Order
Causal inference/Treatment effects

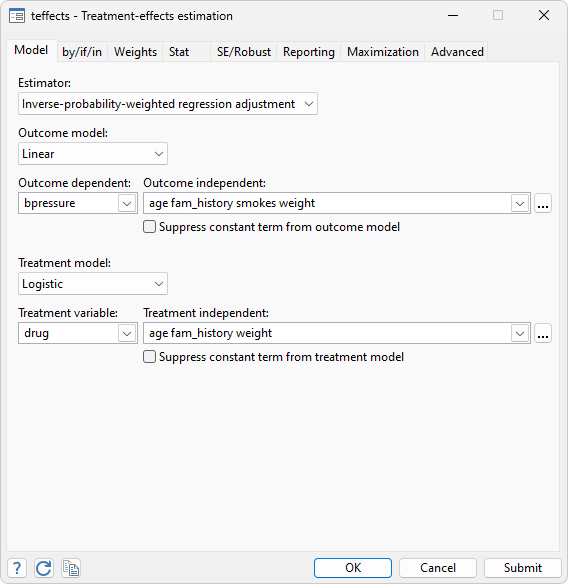
Stata's causal-inference suite allows you to estimate experimental-type causal
effects from observational data. Whether you are interested in a continuous,
binary, count, fractional, or survival outcome; whether you are modeling the outcome
process or treatment process; Stata can estimate your treatment effect. With
the most comprehensive set of causal-inference estimators available in any
software package, you will find the one that's right for you.
Learn about causal inference and causal-inference analysis.
See what's new in causal inference.
Estimators 
- Inverse-probability weights (IPW)
- Propensity-score matching
- Covariate matching
- Regression adjustment
- Weighted regression
- Doubly robust methods
- Difference in differences (DID)
Statistics
- Average treatment effects (ATEs)
- ATEs on the treated (ATETs)
- Potential-outcome means (POMs)
Outcomes
- Continuous—linear
- Binary—logistic, probit, heteroskedastic probit
- Count—Poisson
- Fractional
- Nonnegative, including exponential mean
- Survival—exponential, Weibull, gamma, lognormal
Treatments
- Binary—logistic, probit, heteroskedastic probit
- Multivalued-multinomial logistic
Endogenous treatment effects
Local average treatment effects (LATE) StataNow
- Three weighting estimators
- Normalized kappa
- Normalized covariate balancing
- Inverse-probability-weighted regression adjustment
- Binary, count, continuous, fractional, and nonnegative outcomes
- Balancing diagnostics and overidentification test
- Overlap plots
- Normalized kappa weighted covariate statistics
Endogeneity, Heckman-style selection, and panel data with causal effects
- Linear regression
- Interval regression, including tobit
- Probit regression
- Ordered probit regression
- Exogenous or endogenous regressors
- Endogenous or exogenous treatment; binary or ordinal treatment
- Random-effects models for panel data
Conditional average treatment effects (CATE) New
- Treatment-effects heterogeneity at different levels
- Individualized average treatment effect (IATE)
- Group average treatment effect (GATE)
- Sorted-group average treatment effect (GATES)
- Flexible model specification (lasso, random forest, or parametric regression)
- Evaluate treatment assignment policy
- Treatment-effects visualization
- Histogram of predicted IATEs
- Plot the estimates of GATE or GATES
- Plot of the IATE function
- Toolbox of inferences on the treatment-effects heterogeneity
- Predictions of the IATE function with confidence intervals
- Tests whether the treatment effects are heterogeneous
- Tests whether the estimated GATE or GATEs are statistically equal across group
- Classification analysis of groups sorted by IATE
- Linear approximation of the IATE function
- Nonparametric series approximation of the IATE function
Difference-in-differences (DID) and triple-differences (DDD)
estimation
- DID and DDD estimators for repeated cross-sections data Updated
- DID and DDD estimators for panel data Updated
- DID diagnostics and tests
- Test and graphs for parallel trends
- Granger causality test
- Time-specific treatment effects
- ATET inference with small number of treatment and
control groups
- Bacon decomposition
- Wild bootstrap
- Donald–Lang estimator
- Bias-corrected cluster–robust HC2 and HC3 StataNow SEs
- Bell–McCaffrey degrees of freedom
Heterogeneous DID
- Four estimators
- regression adjustment (RA)
- inverse probability weighting (IPW)
- augmented inverse probability weighting (AIPW)
- two-way fixed-effects regression (TWFE)
- Estimation of heterogeneous treatment effects
- Panel data
- Repeated cross-sectional data
- Graphical representation of treatment effects
- Estimate and visualize aggregations of ATETs within
- cohort
- time
- exposure to treatment
- Estimate moderating effects for TWFE StataNow
- Simultaneous confidence intervals
Causal mediation analysis
- Continuous, binary, and count outcomes
- Continuous, binary, and count mediators
- Binary, multivalued, and continuous treatments
- Linear, logit, probit, Poisson, and exponential mean models
- Two mediators StataNow
- Direct effects, indirect effects, total effects, and POMs
Treatment effects with high-dimensional controls
- Continuous, binary, and count outcomes
- Logit or probit treatment model
- ATEs, ATETs, and POMs
- Lasso or square-root lasso variable selection
- Neyman orthogonal and doubly robust estimator
- Double machine learning
- Flexible model specification
Diagnostics
Postestimation Selector
- View and run all postestimation features for your command
- Automatically updated as estimation commands are run
Additional resources
See New in Stata 19 to learn about what was added in Stata 19.

;)


