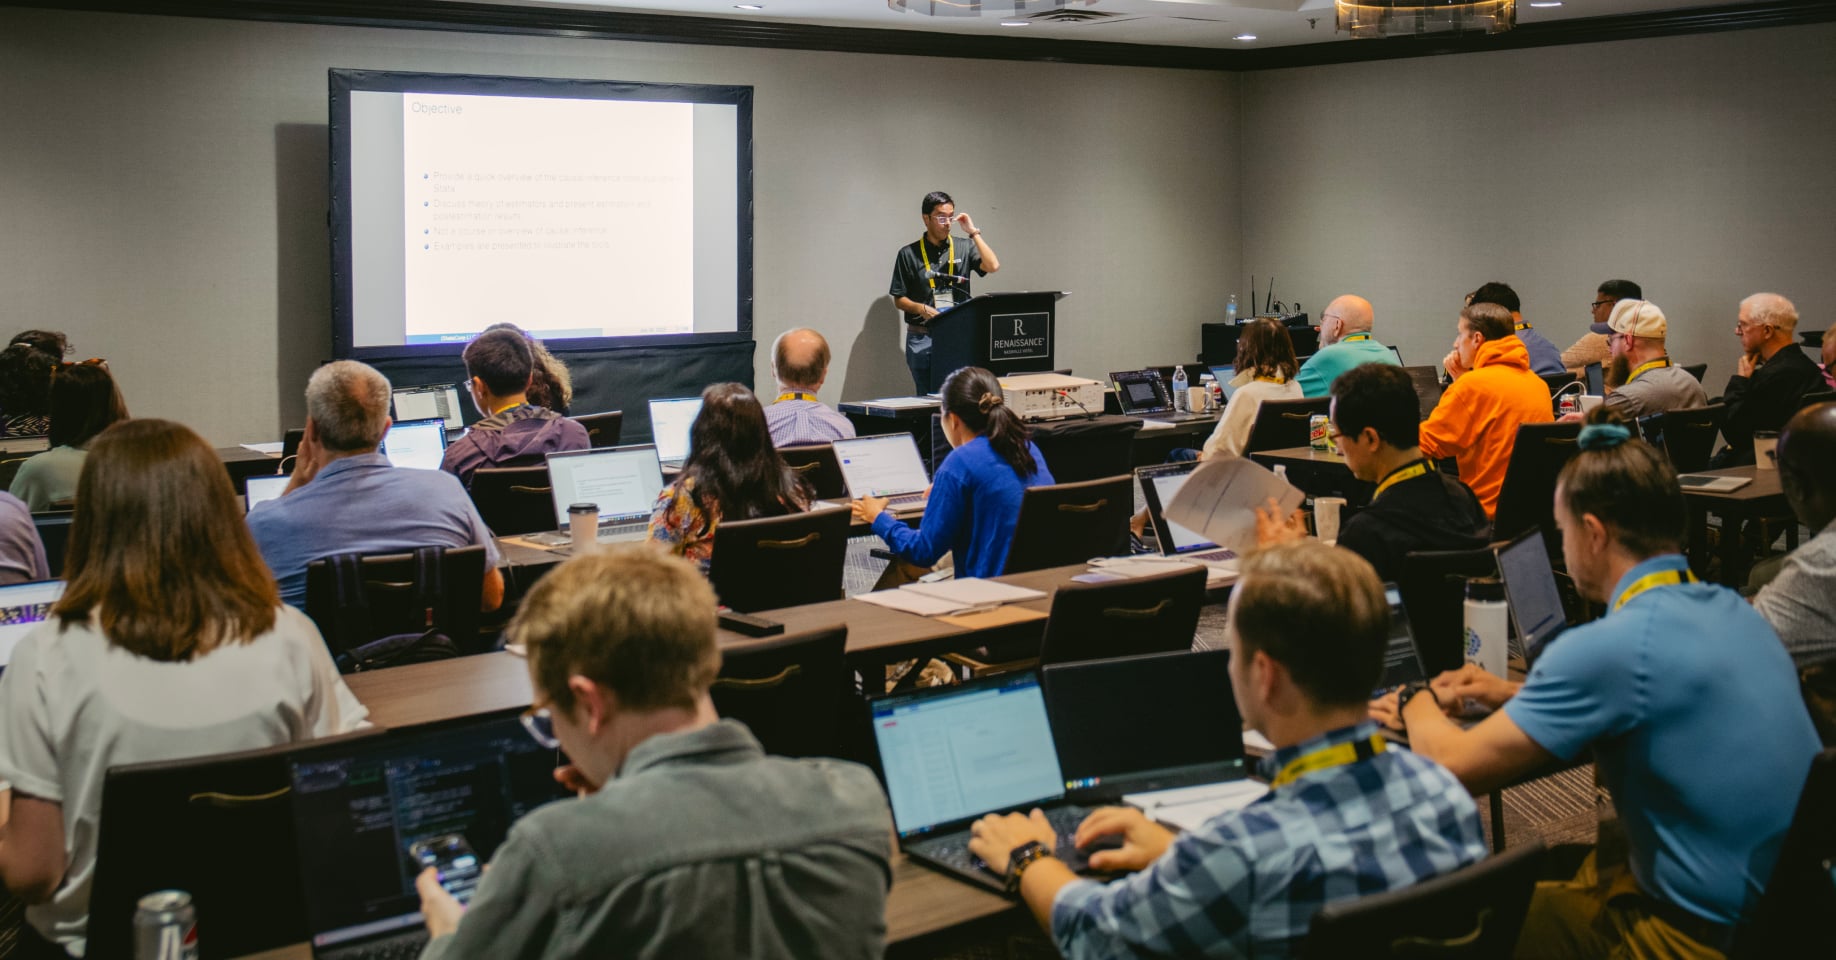


Join us in the heart of New England for the 2026 Stata Conference. Walk the historic Freedom Trail, explore world-class institutions like the Museum of Fine Arts and MIT, or enjoy fresh seafood alongside the bustling harbor.
Whether you’re diving into rich colonial history, catching a game at Fenway Park, or strolling through charming neighborhoods, Boston offers an inspiring blend of tradition, innovation, and culture. Experience the energy of this iconic city while connecting with fellow Stata users from around the world.
Teaching Stata through real failure: What went wrong, what worked, and what we changed
Paris Johnson, Baltimore City Health Department | Coauthor: George Anyumba, Baltimore City Health Department
View abstract
Analysts and students are often taught Stata through polished examples that assume clean data, stable definitions, and linear analytic paths. In practice, applied research rarely unfolds this way. This presentation uses a real-world analytic project as a teaching case to examine how initial assumptions, data structure decisions, and workflow design can fail and how those failures become powerful instructional tools. We describe an early analytic approach that produced technically valid but misleading results due to hidden data fragmentation and flawed unit-of-analysis decisions. Through iterative revision, we restructured the workflow in Stata to reconcile multiple data sources, correct encounter-level logic, and embed quality checks that aligned analysis with real-world decision-making. Rather than focusing on syntax alone, we emphasize how analytic thinking evolved alongside the code. Presented as a dual-instructor narrative, this session demonstrates how teaching Stata through failure improves methodological rigor, transparency, and learner confidence. Attendees will gain practical strategies for teaching data management, model interpretation, and analytic judgment using imperfect data skills essential for applied work across disciplines.
From Qualtrics to Word: Automating survey workflows in Stata
Inah Ko, University of Michigan
View abstract
This presentation describes a Stata-based workflow for processing Qualtrics survey data, from initial import to a Word report. Survey-based research and program evaluation often require repeated manual steps across different tools, including data export and import, data cleaning, recoding variable names and values, creating plots, and assembling results into a written report. These tasks are not only time consuming but also prone to inconsistency and error, particularly when repeated across multiple survey waves.
To reduce this manual work, I present a Stata-centered workflow that uses API-based data retrieval, metadata-driven recoding from the Qualtrics survey structure, and data visualization by running R and Python within Stata when helpful. This approach reduces manual processing and makes the pipeline easier to rerun. The presentation focuses on practical strategies that Stata users can adapt to their own survey analysis workflows.
Rolling difference-in-differences estimation for small and large panels
Soo Jeong Lee, Southern Illinois University Carbondale | Coauthors: Elizabeth Kayoon Hur and Jeffrey M. Wooldridge, Michigan State University
View abstract
We introduce lwdid, a Stata command that implements the rolling difference-in-differences (DID) estimator proposed by Lee and Wooldridge (2025). The rolling approach transforms the panel-data DID problem into a sequence of cross-sectional treatment-effect estimation problems, allowing flexible estimation of treatment effects in settings with staggered adoption and treatment-effect heterogeneity.
The command is further designed to accommodate both large and small panels. In particular, it also implements the extension developed in Lee and Wooldridge (2026) for small-panel settings, where the number of cross-sectional units is limited and conventional large-sample asymptotic inference may be unreliable.
For large panels, a key feature of lwdid is that it provides computationally efficient inference using a multiplier bootstrap based on exact influence functions of the estimators. Because this approach avoids repeated model estimation, it substantially reduces computational cost. For settings with a small number of units, lwdid also provides valid inference procedures. Under normality, exact inference can be conducted using the t distribution, while HC3-based inference and randomization inference are provided as alternatives that require weaker assumptions.
Overall, lwdid provides applied researchers with a practical and efficient tool for estimating treatment effects within the rolling DID framework.
Heterogeneous DID when units switch in and out of treatment
Enrique Pinzón, StataCorp
View abstract
In this talk, I will introduce the new xtswitchdid command, which provides event-study treatment effects for panel data when subjects are allowed to switch in and out of treatment. This is an implementation of the estimator proposed in de Chaisemartin and D'Haultfoeuille (2024). I will also discuss how xtswithchdid fits into the difference-in-differences estimators that have been implemented in the past couple of Stata releases and how it fits the evolution of our understanding of DID.
A flexible, heterogeneous treatment-effects difference-in-differences estimator for repeated cross-sections
Jeff Zabel, Tufts University | Coauthors: Partha Deb, Hunter College of the City University of New York; Edward C. Norton, University of Michigan; Jeffrey M. Wooldridge, Michigan State University
View abstract
The difference-in-differences (DID) study design is an important tool for causal inference. A commonly observed special case involves a staggered entry into treatment. In this context, the observation that the standard two-way fixed-effects estimator that assumes a constant treatment effect across cohorts and time can produce a biased estimate of the overall treatment effect has led to several new approaches for dealing with both staggered timing and heterogeneous treatment effects (for example, Callaway and Sant’Anna 2021).
In Deb et al. (2025)*, we show that an appropriate regression specification using a pooled repeated cross-sectional sample can provide consistent treatment effects in a DID design with staggered entry under the usual DID assumptions. Our flexible linear model estimated by ordinary least squares with covariates (X)—FLEX—allows the covariates to enter the model in a flexible way. To be precise, we prove that FLEX is equivalent to an imputation estimator derived in Borusyak et al. (2024). In this presentation, we will describe FLEX and the associated Stata command, flexdid. We will illustrate the use of FLEX with an empirical example and provide comparisons with some benchmark estimators.
*https://www.nber.org/papers/w33026
Creating interactive dashboards in Stata with dash
Billy Buchanan, SAG Corporation
View abstract
This talk will describe a new command intended to serve as a near drop-in replacement for twoway to create interactive dashboards in Stata and how the command was developed. This is functionality that several users have requested at previous Stata conferences, and it is now here using syntax that Stata users already know. Just replace twoway with dash and you can be on your way. The inclusion of the Bootstrap CSS framework provides responsive dashboards that will resize themselves automatically based on the device's screen size.
From messy strings to analysis-ready data: Practical data cleaning with Stata string functions and regular expressions
Rixin Wen, Claremont Graduate University
View abstract
Data cleaning is often the most time-consuming stage of empirical analysis, particularly when raw data contain inconsistencies in formatting, encoding, and structure. While Stata provides a range of built-in commands (for example, destring, split, date) for basic transformations, these tools are frequently insufficient for handling irregular or unstructured string variables encountered in practice. This presentation demonstrates how Stata’s string functions and regular expression capabilities can be used to efficiently transform messy, real-world datasets into analysis-ready formats. Drawing on examples from research subject and teaching experience, I illustrate common data issues, including nonnumeric values stored as strings, concatenated characters, and inconsistent delimiters.
The session introduces a set of practical workflows that combine standard string commands with regex-based solutions to identify, parse, and restructure problematic variables. Emphasis is placed on reproducibility, efficiency as well as efficacy, and minimizing manual intervention. Attendees will gain hands-on strategies for diagnosing data irregularities, applying flexible string manipulation techniques, and integrating these methods into their empirical workflow. The presentation is intended for applied researchers, instructors, and students seeking to improve data preparation and conversion in Stata.
Keywords: data cleaning; string functions; regular expressions; reproducibility; Stata
Predictors of electrical vs pharmacologic cardioversion in critically ill patients with atrial fibrillation
Sidra Ambreen, Harvard Medical School
View abstract
Introduction: Atrial fibrillation (AF) is common in critically ill patients and may worsen hemodynamic instability. Cardioversion is often required for rhythm control. Factors influencing the choice between electrical and pharmacologic cardioversion remain unclear. This study evaluated whether clinical variables, including age, acute coronary syndrome, acute respiratory failure, chronic heart failure, and hypertension, are associated with cardioversion strategy.
Methods: A retrospective observational study was conducted using the Atrial Fibrillation in Critically Ill dataset. Critically ill adult patients with preexisting AF admitted to the ICU were included. The primary outcome was cardioversion strategy (electrical versus pharmacologic) during hospitalization. Predictor variables included age, ACS, ARF, CHF, and HTN. Multivariable logistic regression analysis was performed using Stata (BE 19) to estimate adjusted odds ratios with 95% confidence intervals.
Results: Among 1,705 critically ill patients with AF, 179 (10.5%) underwent electrical cardioversion and 290 (17.0%) received pharmacologic cardioversion. ARF was present in 397 patients (23.3%), ACS in 212 patients (12.4%), CHF in 693 patients (40.6%), and HTN in 838 patients (49.1%).
Discusion: Hypertension was associated with increased electrical cardioversion, possibly representing a more stable patient subset. Overall, these findings support a context-driven approach to cardioversion in critically ill patients, prioritizing physiologic stability and reversibility of illness.
Epi-nomics: Applying lessons from epidemiology research on misclassification to economics policy evaluation
Patrick Koval, Boston University School of Public Health | Coauthor: Daniel Schwab, College of the Holy Cross
View abstract
Policy evaluation in economics examines the effect of regulations on aggregate outcomes, but economics research rarely considers misclassification of the outcome of interest. We apply simulation methods that are well established in epidemiological analysis to determine when under- or overreporting leads to bias of causal estimates in policy analysis, with a focus on difference-in-differences methodology. First, we simulate data with perfect sensitivity and imperfect specificity; mean absolute bias in this case is close to zero as long as specificity is similar for exposed and nonexposed units but is sizable when specificity varies by exposure. Next, we show that with perfect specificity and imperfect sensitivity, mean absolute bias is highest when sensitivity is low for untreated units and high for treated units. Finally, we present a new Stata program that presents difference-in-differences estimates corrected for under- and over-counting under a range of plausible assumptions about misclassification.
Beyond teffects and lateffects: Average and local average treatment effects with covariates in Stata
Tymon Sloczynski, Brandeis University | Coauthors: S. Derya Uysal, LMU Munich; Jeffrey M. Wooldridge, Michigan State University
View abstract
This presentation, based on joint work with S. Derya Uysal and Jeffrey M. Wooldridge, introduces three Stata commands for treatment-effect estimation with covariates: teffects2, kappalate, and drlate. The talk combines the underlying econometric ideas with a practical discussion of implementation and empirical use. First, teffects2 extends Stata's teffects by implementing IPW, AIPW, and IPWRA estimators for ATE and ATT with exact-balancing inverse probability tilting weights; it can also be used for ATT in difference-in-differences settings. Under these weights, several estimators that usually differ become numerically identical, simplifying interpretation and practice. Second, kappalate implements normalized weighting estimators of LATE, emphasizing finite-sample properties that matter in applications, including invariance to outcome recoding and advantages under one-sided noncompliance. Third, drlate introduces doubly robust IPWRA estimators of LATE and LATT. Throughout, I compare these commands with Stata's built-in teffects and lateffects.
Clinical trial design using Stata
Alex Asher, StataCorp
View abstract
We will discuss power and sample-size computations for clinical trials, starting with simple fixed-sample designs with closed-form solutions and ranging to more complex adaptive designs and calculations via simulation. We will explore ways to add your own power and sample-size calculations to Stata and how to leverage AI tools when designing clinical trials in Stata.
Visualizing complex policy sequences in Stata using flexible subsetting
Andrea Chu, American University
View abstract
Researchers often need to visualize how policy events evolve, intersect, branch, and diverge over time so they can better understand complex policy processes and identify patterns that may later be linked to macroeconomic or other aggregate outcomes. This is especially valuable when the same policy history can be examined under different analytical lenses, such as narrow sectoral categories or broader policy groupings. In Stata, however, visualizing these interacting event structures is not straightforward from a flat one-record-per-event dataset, particularly when the same data must be repeatedly restructured into alternative views. I propose a workflow that addresses this challenge through flexible subsetting and by organizing events into stages. The workflow allows the same dataset to generate alternative policy process maps efficiently. In the sanctions context, for example, events can be grouped narrowly by sectoral sanctions or more broadly by financial and trade sanctions, revealing different event flows and helping researchers trace how policies connect and evolve over time.
Implementing mixed-data sampling models for temporal sampling and aggregation in Stata
Stephen Snudden, Wilfrid Laurier University | Coauthor: Quinlan Lee, University of Toronto
View abstract
Many economic forecasts are constructed for temporally aggregated variables, such as monthly averages or quarterly sums, even when high-frequency data are available. Recent work on temporal aggregation shows that using only monthly or quarterly data can substantially reduce forecast accuracy and distort forecast evaluation. This presentation shows how Stata users can exploit high-frequency information using mixed-data sampling (MIDAS) methods. I first demonstrate how unrestricted MIDAS and restricted MIDAS can be implemented in Stata using existing data-management and time-series commands. These methods are straightforward to code and produce large gains relative to monthly or quarterly benchmarks, but they recover only part of the efficiency available from high-frequency information. I then show how to implement bottom-up MIDAS (BUMIDAS) methods. BUMIDAS reduces the number of parameters by up to a factor equal to the aggregation frequency and is the direct-forecast equivalent of optimal recursive bottom-up approaches.
In the applications, daily recursive methods and bottom-up MIDAS reduce forecast errors by roughly half relative to standard monthly or quarterly approaches, and BUMIDAS often outperforms recursive methods in practice. Prototype Stata code is provided to automate aggregation, lag construction, estimation, forecasting, and forecast comparison across low-frequency, UMIDAS, RMIDAS, recursive bottom-up, and bottom-up MIDAS methods.
mlim: Single and multiple imputation with automated machine learning
E.F. Haghish, University of Bergen
View abstract
Missing data are common in empirical research. Standard imputation tools require users to specify model forms and tuning parameters before it is clear which model best fits each incomplete variable. As data become more complex, for example because of nested structures, mixed variable types, or low-prevalence categories, imputation becomes more difficult.
mlim is a new Stata package that uses automated machine learning for single and multiple imputation in mixed datasets. For each incomplete variable, mlim builds and tunes a separate prediction model, rather than applying one predefined model to all variables. The default method is elastic net, with optional random forest, gradient boosting, and stacked ensemble models for more computationally demanding applications. The package supports large datasets with continuous, binary, multinomial, and ordinal variables and includes automatic balancing procedures to reduce bias when categorical variables contain rare levels. This presentation introduces mlim to the Stata community as a competent open-source software for single and multiple imputation. It discusses the motivation, workflow, strengths, limitations, and examples of how Stata users can apply mlim to impute missing data.
Open panel discussion with Stata Developers
View abstract
Contribute to the Stata community by sharing your feedback with StataCorp's developers. From feature improvements to bug fixes and new ways to analyze data, we want to hear how Stata can be made better for our users.
Bootstrapping time-dependent stationary processes
Kit Baum, Boston College | Coauthor: Jesús Otero, Universidad del Rosario, Colombia
View abstract
We present the community-contributed blockboot command to bootstrap time-dependent stationary processes using four schemes that preserve the processes' dependence structure by resampling blocks of observations. These schemes include the nonoverlapping block bootstrap of Carlstein (1986, Annals of Statistics 14: 1171–1179); the moving block bootstrap of Künsch (1989, Annals of Statistics 17: 1217–1241) and Liu and Singh (1992, in Exploring the Limits of Bootstrap, ed. LePage and Billard: Wiley); the circular block bootstrap of Politis and Romano (1992, also in Exploring the Limits of Bootstrap); and the stationary block bootstrap of Politis and Romano (1994, Journal of the American Statistical Association 89: 1303–1313). An illustration of these four block bootstrap schemes for time-series data in the context of computing the size of unit-root tests extends and updates the findings of Schwert, "Tests for Unit Roots: A Monte Carlo Investigation" (1989, Journal of Business and Economic Statistics 7: 147–159). We find that the results are most sensitive to the choice of block length, which can be specified in the command or computed automatically.
sparkta - Interactive, self-contained HTML charts and dashboards from Stata
Fahad Mirza, World Bank
View abstract
Sparkta (Spark Stata) is an open-source Stata package that produces self-contained, interactive HTML dashboards directly from a single Stata command. The package does not require any external installation of Python or R and makes use of the Java API. Sparkta outputs HTML files that run in any browser with no server, internet connection, and external dependencies, making them safe for institutional and air-gapped environments. The package supports 20 chart types, including bar, line, scatter, area, histogram, pie, boxplot, violin, and confidence interval charts. Charts are rendered using Chart.js and follow Stata syntax conventions throughout: options such as over(), by(), if, in, filter(), and value label awareness all behave as Stata users expect.
Sparkta combines interactive visualization with live Stata-computed statistics. A collapsible panel beneath each chart reports N, mean, SD, median, and confidence intervals computed to match Stata's own summarize and ci means commands exactly. Additional features include an offline mode that bundles all JavaScript locally, a PNG download button, reference line and annotation overlays, animated transitions, named color palettes, including a colorblind-safe option, and over 130 styling and layout options.
Sparkta is available on GitHub and is being prepared for SSC submission.
Wednesday, 30 September | 9:00 a.m.–12:00 p.m.
Alvaro Fuentes Higuera
The margins and contrast commands are the core of Stata postestimation, the analysis we do after fitting a statistical model. They allow us to extract information from our predictions, to compute and visualize marginal effects (even when complicated nonlinearities abound), and to understand and test differences across the groups defined by our categorical covariates, among many other important tasks. [Read more ...]

Alvaro Fuentes Higuera is a Senior Econometrician at StataCorp LLC. His PhD research at the Leibniz Institute for Science and Mathematics Education in Kiel, Germany, focused on propensity-score methods for causal inference with multilevel data. At Stata, he produces documentation and other written materials and develops and presents trainings.
Wednesday, 30 September | 1:00–4:00 p.m.
Eduardo García Echeverri
Which customers are most likely to default on a loan? What key factors drive the market value of professional athletes? How does the effectiveness of a medical treatment change based on individual patient characteristics? This workshop covers the most popular and powerful machine learning (ML) techniques available in Stata to help you answer complex, data-driven questions like these. [Read more ...]

Eduardo García Echeverri is a Senior Econometrician at StataCorp LLC. He holds a PhD in economics from the University of Rochester and a master’s degree from Universidad de los Andes in Colombia. His research focuses on nonparametric and semiparametric methods in econometrics. At Stata, he produces documentation, develops webinars, and contributes to the development of new statistical features.
The scientific committee plays a vital role in organizing the Stata Conference. From reviewing abstracts for the program to promoting community engagement, the committee helps foster an exciting, diverse, and informative event for both new and longtime Stata users.
We look forward to seeing you in Boston!







200 Stuart Street
Boston, MA 02116
The conference venue and hotel is located at Revere Hotel Boston Common, located in the heart of historic downtown Boston. Use the link below to reserve a room directly with the hotel.
Preconference workshop
$65 (per workshop)
Users' dinner
$65
Stata Conference attendees are invited to join us for our annual users’ dinner at Petit Robert Bistro on Thursday, 1 October at 6:30 p.m. Enjoy classic French cuisine served family style while you network with other Stata users. Limited seating is available, and you must register above to attend.

Petit Robert Bistro
480 Columbus Ave
Boston, MA 02118
(617) 867-0600
Looking for something to do the night before the conference? Join us on Wednesday, 30 September, from 5:00 p.m. to 7:00 p.m. at the Lantern Lounge, located adjacent to the Rooftop@Revere. See spectacular views of the city and meet some fellow attendees. Kindly RSVP to help us plan complimentary hors d'oeuvres and beverages accordingly.

Rooftop@Revere
200 Stuart St
Boston, MA 02116
(617) 574-2751
Have questions about the Stata Conference?
Our FAQs have you covered.
Discover important details on registration, logistics, and more.
Expand all descriptions
The 2026 Stata Conference will be held between 8:00 a.m. and 5:00 p.m. EDT on Thursday, 1 October, and Friday, 2 October, in Boston, Massachusetts. Everyone is also invited to attend our preconference workshop on Wednesday and our annual users' dinner on Thursday night. The venue and accommodations will be at Revere Hotel Boston Common, located in the heart of downtown Boston.
The Stata Conference is open to users of all disciplines and experience levels, bringing together a unique mix of experts and professionals. You will hear from Stata users at the top of their fields, as well as Stata's own researchers and developers. Presentation topics will include new community-contributed commands, methods and resources for teaching with Stata, new approaches to using Stata together with other software, and much more. Anyone interested in Stata is welcome to attend.
Look forward to meeting the following StataCorp employees:
Yes! The Stata community is full of users from all disciplines, including people you may have met online but would like to meet in person. There will be breaks between sessions where you can take a moment to talk to the people around you and an open panel discussion where you can ask questions and share feedback with Stata developers.
Everyone is also invited to join a welcome social on Wednesday and an optional users' dinner Thursday night.
Want to start socializing now? Follow @Stata on X. Throughout the conference, we will be live tweeting using the conference hashtag #Stata2026.
The conference presentations will not be recorded, but proceedings and slides will be made available on this page in the following weeks after the conference.
Receive notifications regarding conference agenda, registration, and lodging information for the 2026 Stata Conference.