Summaries
- Arithmetic, geometric, and harmonic means, and corresponding
confidence intervals

- Medians and percentiles
- Measurement of central tendency
- Skewness and kurtosis
- Confidence intervals
- Means
- Proportions
- Exact binomial (Clopper–Pearson)
- Wald
- Wilson
- Jeffreys
- Agresti
- Variance
- Ratios, proportions, and totals
- Confidence intervals
- Standard errors
- Over groups
- Robust and cluster–robust SEs
- Intragroup tests
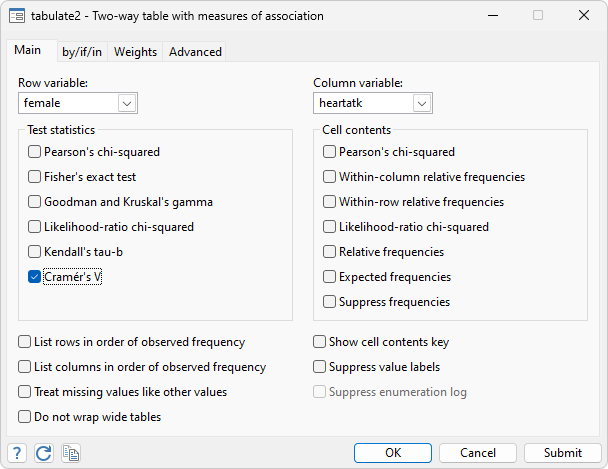
Tables and tabulations
- 1- , 2- , n-way Updated
- Pearson's chi-squared
- Likelihood-ratio chi-squared
- Cramér's V
- Fisher's exact (2 x 2 and r x c)
- Goodman and Kruskal's gamma
- Kendall's tau
- Cell statistics
- Expected count
- Contribution to Pearson chi-squared
- Contribution to likelihood-ratio chi-squared
Tables of summary statistics
- Over groups and/or variables
- Statistics may include mean, count, sum, min, max, range, standard
deviation, variance, variation coefficient, standard error of
mean, skewness, kurtosis, median, percentiles, and interquartile range
- Results from any summary-statistics command
Creation of datasets of summary statistics
- Statistics by group or subgroup of observations
- Statistics: mean, standard deviation, count, min, max, median,
percentiles, and interquartile range
Pairwise comparisons of means
- Pairwise differences in means with tests and confidence intervals
- Multiple-comparison adjustments: Bonferroni, Šidák,
Scheffé, Tukey HSD, Duncan, and Student–Newman–Keuls adjustments
- Group comparisons that are significant
- Balanced and unbalanced data
See New in Stata 19 to learn about what was added in Stata 19.

)


