Order
IRT (item response theory)
Explore the relationship between unobserved latent characteristics such as
mathematical aptitude and the probability of correctly answering test
questions (items). Or explore the relationship between unobserved health and
self-reported responses to questions about mobility, independence, and other
health-affected activities. IRT can be used to create measures of such
unobserved traits or place individuals on a scale measuring the trait. It can
also be used to select the best items for measuring a latent trait. IRT models
are available for binary, graded, rated, partial-credit, and nominal response
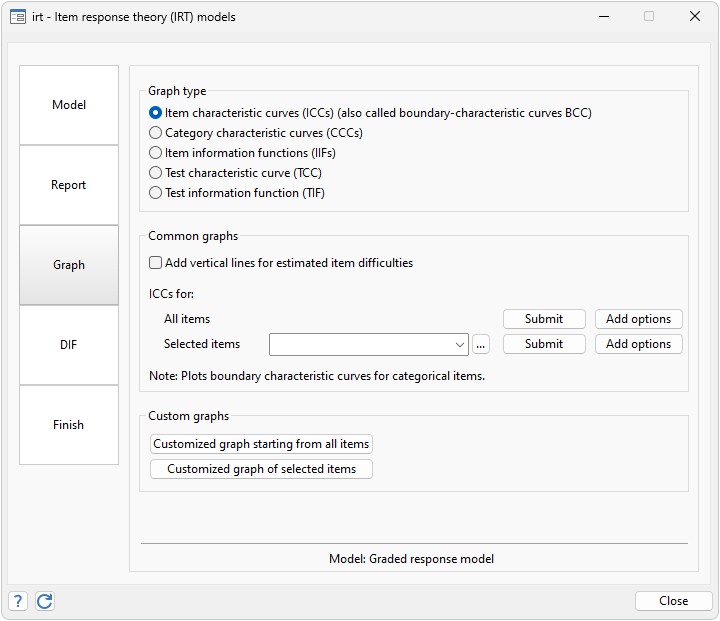
items. Visualize the relationships using item characteristic curves, and
measure overall test performance using test information functions. And much
more.

Control panel interface 
- Access all IRT features
- Easily select response type and item variables
- Even create hybrid models
- Estimate models
- Select and customize graphs
- Manage reporting of results
Control how your output is displayed
- Sort by difficulty
- Sort by discrimination
- Group estimates by type or by item
- Show results only for selected items
- Compare IRT estimates across groups
Postestimation Selector
- View and run all postestimation features for your command
- Automatically updated as estimation commands are run
Additional resources
See New in Stata 19 to learn about what was added in Stata 19.

;)
;)
;)


