ORDER STATA
Reporting
With Stata's reporting features, you can easily incorporate Stata
results and graphs with formatted text and tables in Word, PDF,
HTML, and Excel formats. Take advantage of Stata's integrated
versioning to create reproducible reports. Dynamic documents can
be updated as your data change.
Learn about reporting.
Report formats
Reproducible reporting
- Entire analysis and document easily recreated
- Integrated version control
- Ensure Stata commands produce the same results in the future
- Verification that data has not changed
Dynamic documents
- Update reports as data changes
- Rerun one command or do-file to automatically change full document
Incorporate Stata graphs and other images
Customize text and tables within reports
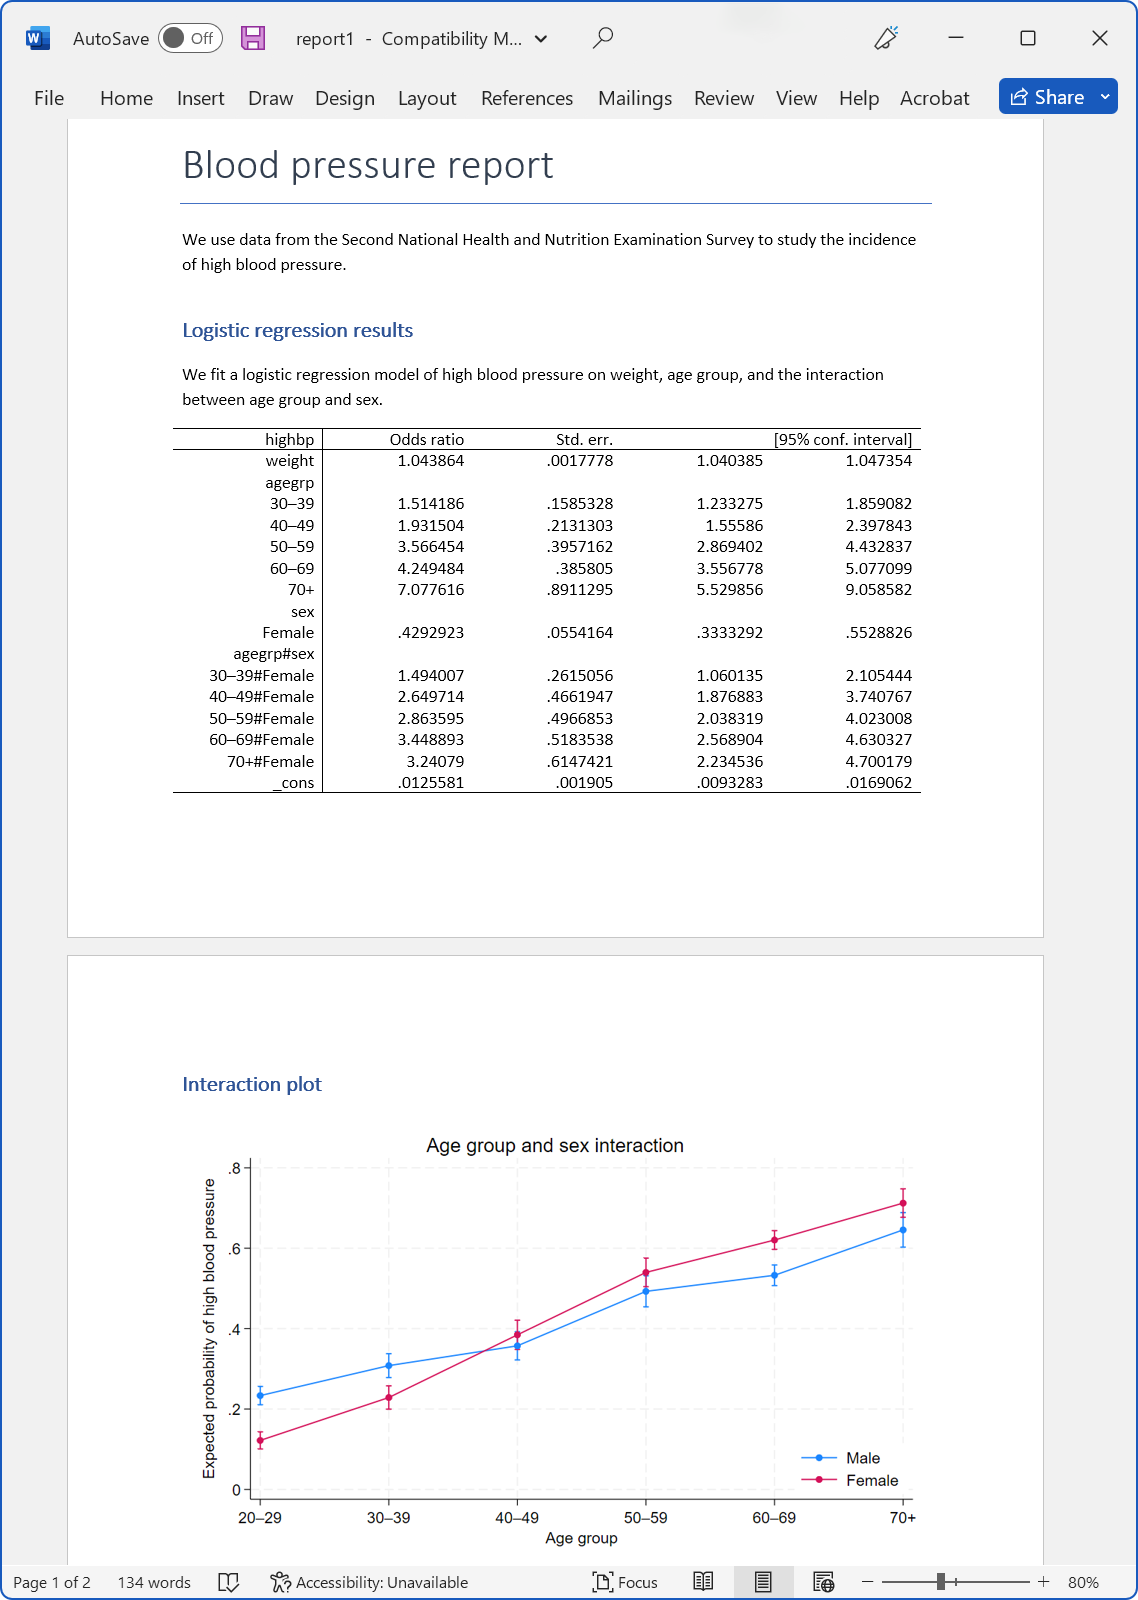
- Font, size, and color
- Bold, italics, and underlines
- Formatted numbers from Stata results
- Headings and subheadings
- Hyperlinks
- Shading
- Spacing
- Borders
Markdown 
- Create formatted HTML and Word documents
- Combine with dynamic tags to intermix Stata output and graphs
Customizable tables
New
- Build tables with results from Stata commands

- Summary statistics

- Hypothesis tests

- Regression results

- Postestimation tests

- Marginal means, marginal effects, adjusted predictions
- Customize table look

- Table layout

- Row and column header styles

- Numeric formats, font, shading, color, and alignment

- Labels
- Export to MS Word®, PDF, HTML, LaTeX, MS Excel®, or Markdown

- Incorporate into reports

Convert file types
- HTML to Word

- Word to PDF

Low-level programming for fine control
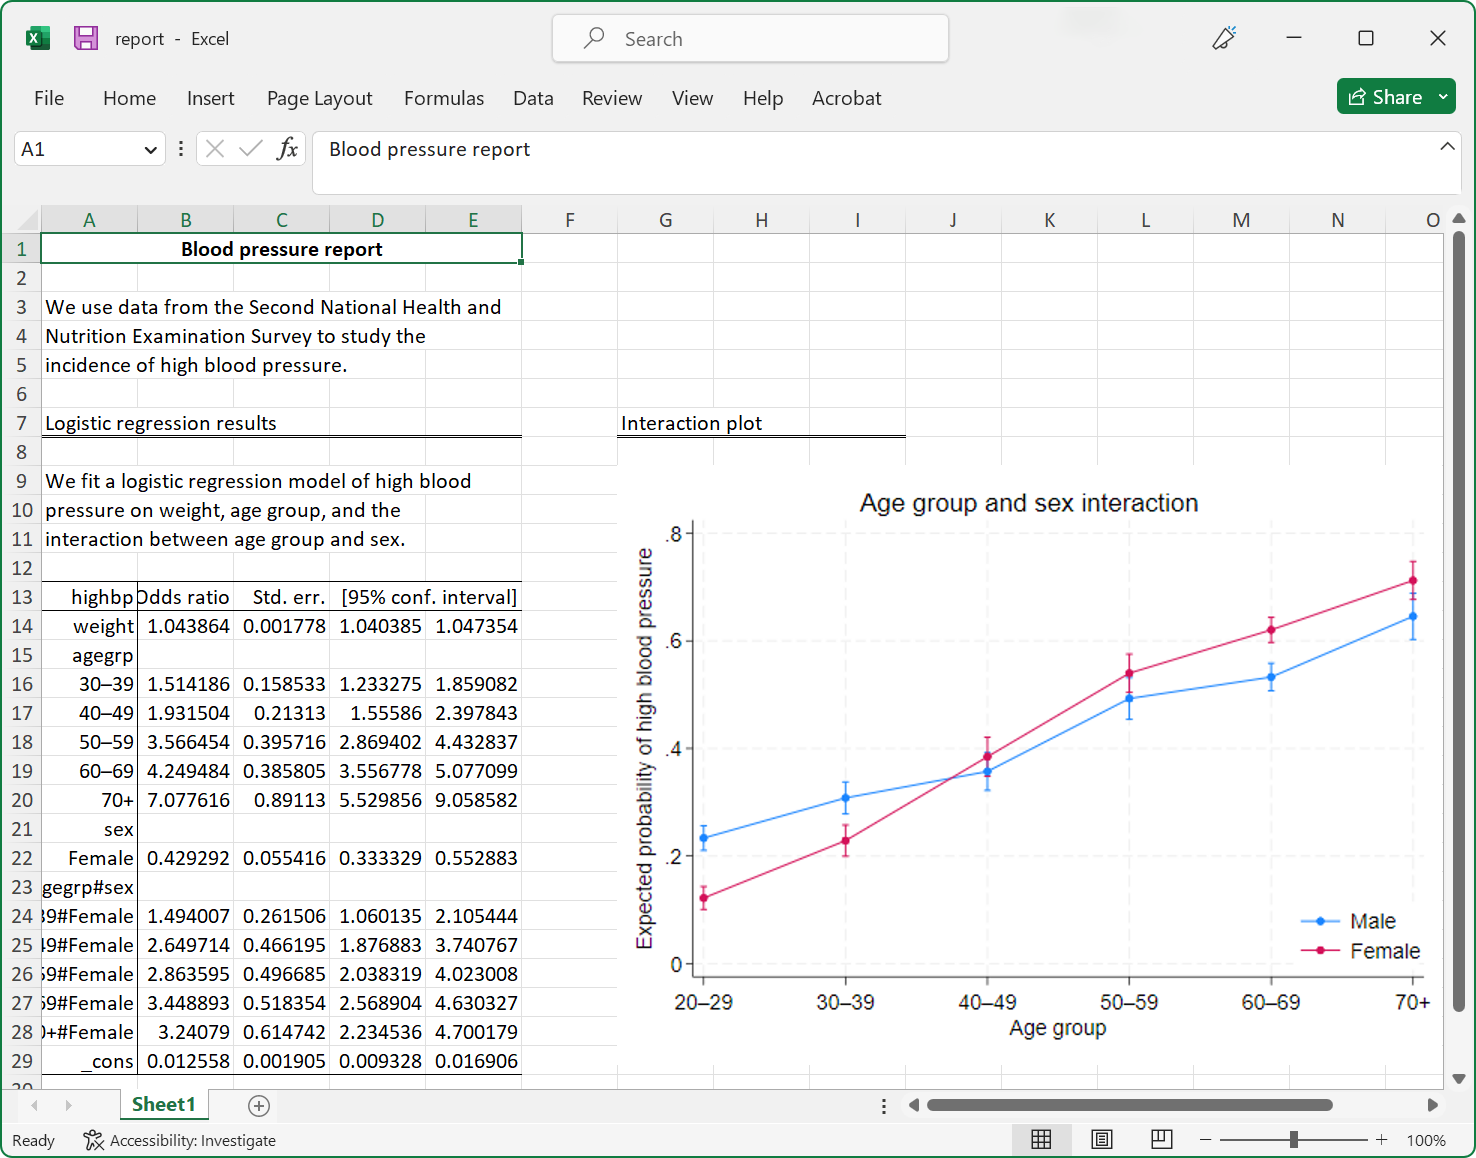
- Word documents
- PDFs
- Excel
Additional resources
Read an
overview of reproducible reporting in Stata
See New in Stata 17 to learn about what was added in Stata 17.