Create both .xls and .xlsx files
Insert worksheet page headers and footers
Insert worksheet horizontal and vertical page breaks
Add worksheet cell named ranges
Freeze a column or row or both
Export a Stata matrix in memory, command return results, or a from collection to a worksheet
Export a custom numeric or string Stata expression
Export Stata date and datetime data to Excel date and datetime data
Insert a Stata graph or any PNG, JPEG, WMF, or TIFF file to a worksheet
Create Excel cell formulas in a worksheet
Format cells in a worksheet
Number formats
Cell border style and color
Horizontal and vertical alignment
Fill patterns and foreground/background color
Merge cells
Font formatting
Font, font size, font color
Bold, italic, strikeout, underline
Subscripts
Text wrapping, text indent, text rotation
Add a new worksheet to an existing workbook
Replace a single worksheet within an existing workbook
Modify a subset of cells within an existing worksheet
Stata gives you much control over how your results are formatted in Excel. You can insert string and numeric values into specific cells in worksheets, format cells, format the contents of the cells, and even add graphs and formulas.
Examples of cell formats you can change include changing the numeric format, adding borders, and choosing the cell color. You can control the font style used in the cell, such as whether you want bold or italics, or whether you want text in a different color. And, a wide range of graph file formats can be written, including PNG, JPEG, WMF, and TIFF. This is just a sampling of what you can do.
These features are useful for creating custom-formatted tables in Excel and automating the creation of graphs so that all of your work is fully reproducible.
Suppose we have an Excel worksheet that contains a summary of response rates to a Medicare survey about satisfaction with hospital care for 5 states: AK, AL, AR, AZ, and CA.
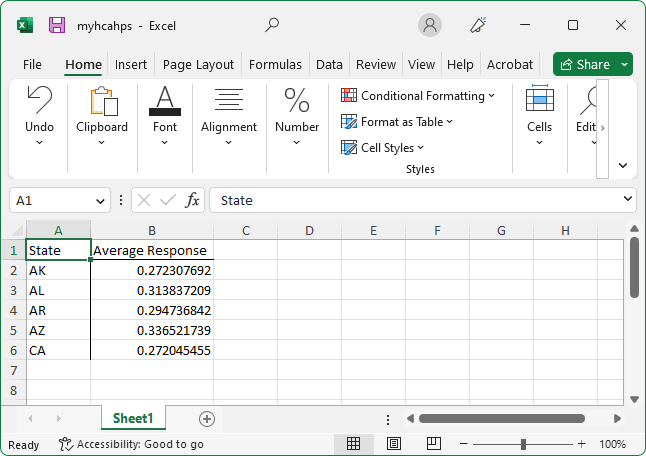
You can bold the column titles with the command
. putexcel set myhcahps.xlsx
. putexcel (A1:B1), bold
Now let's add a solid black border below the column titles and on the right side of the State column.
. putexcel (A1:B1), border("bottom", "medium", "black")
. putexcel (A1:A6), border("right", "medium", "black")
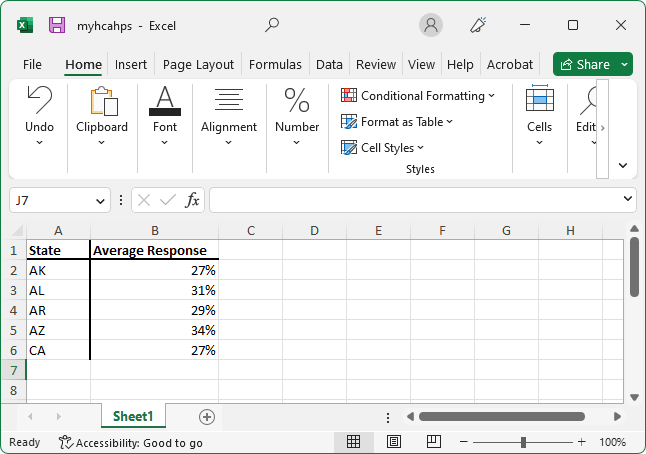
We can then format the Average Response column as a percent.
. putexcel (B2:B6), nformat("percent")
The Excel worksheet now looks like
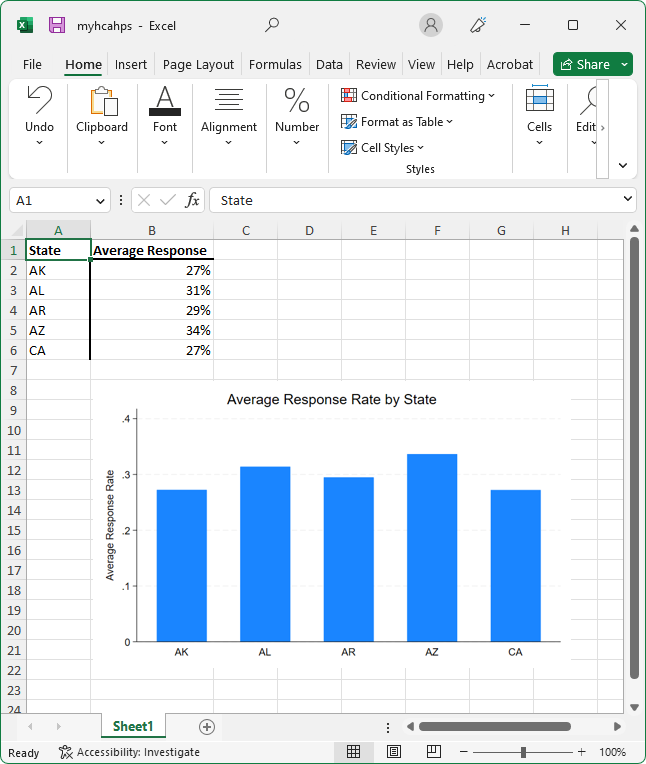
To insert a Stata bar graph, bar1.png, into the worksheet, type
. putexcel (B8)=picture("bar1.png")
The Excel worksheet now looks like
If we want, we could add all of these commands to a do-file and save them for use with updated data or data from other states we may choose to sample.
You can read more about putexcel's features and see several examples in [RPT] putexcel.
For more cell-formatting settings and control of writing cell formats, programmers will want to use the xl() Mata class; see [M-5] xl().


