Create and Export Tables Using Stata |
||||||||||||||||||||||||||||||||||||||
 Click to enlarge See the back cover |
$78.00 Print Add to cart$63.00 VitalSource eBook Add to cart$62.00 Amazon Kindle Buy from Amazon
As an Amazon Associate, StataCorp earns a small referral credit from
qualifying purchases made from affiliate links on our site.
|
Preface
Subject index Errata Download the datasets used in this book (from stata-press.com) Review from the Stata Journal |
||||||||||||||||||||||||||||||||||||
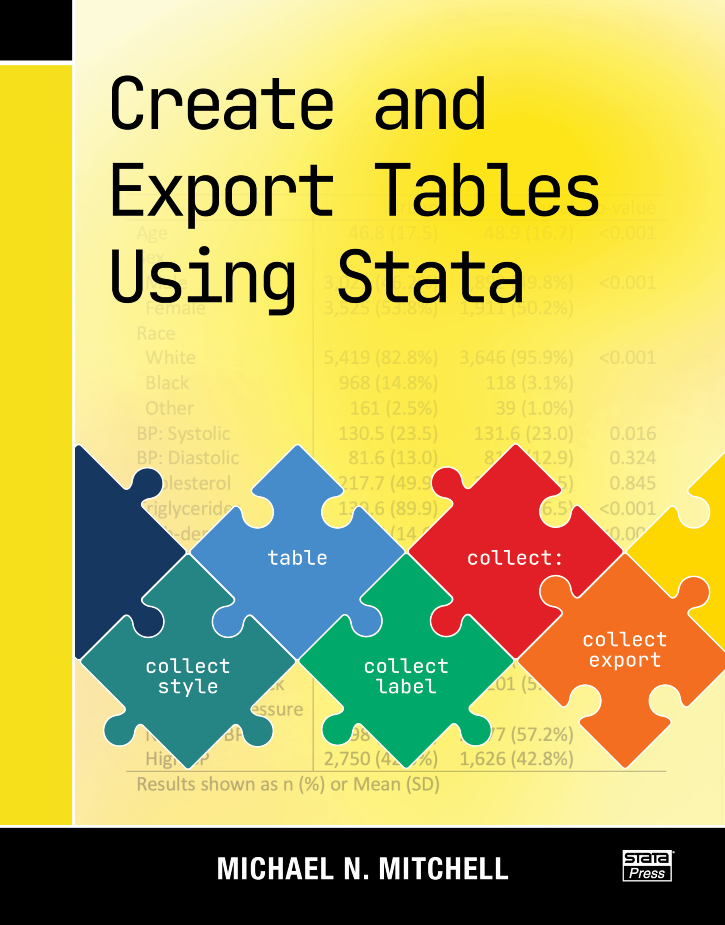
Comment from the Stata technical groupIn Create and Export Tables Using Stata, Michael Mitchell teaches you how to expertly craft custom, publication-quality tables of summary statistics, regression results, and more. Mitchell examined hundreds of published journal articles from many disciplines, searching for commonly used table layouts. This book breaks down how to create the most popularly used tables by guiding you through examples using Stata’s table, dtable, and etable commands, as well as the collect suite of commands. This book begins with 24 sample tables, including 6 examples of a Table 1, 8 examples of regression models, 4 examples with Student's t tests, and an example of reporting results from a pretest–posttest design. Each sample table is illustrated step by step, showing you how to create it, customize it, and export it as a Word document. You'll also learn how you can export your table as a PDF or an Excel spreadsheet. After the quick examples, the book takes a more thorough look at the process of creating a Table 1—a table of descriptive statistics that optionally includes a comparison across groups. This discussion also includes extensive instruction on how to create different types of composite results to include in your table; composite results combine multiple statistics into one cell, such as the mean (SE) or median (IQR). Next Mitchell focuses on creating tables from regression models, such as multiple regression, multivariate regression, logistic, and multinomial logistic models, and illustrates how to make tables that combine results from several models. The book ends with a look under the hood, describing what a collection looks like and the steps used by the collect suite of commands for creating a table and filling it in based on the contents of the collection. This information can help you more deeply understand the process of creating tables and help you make more complex tables using Stata. Create and Export Tables Using Stata is integral to anyone reporting data characteristics or analysis. You will learn how to create tables with the layout, formatting, and style you need. Optimize your workflow by using your styles to automate the creation of any future tables. You will take this book off your shelf over and over again as it quickly becomes your go-to reference for creating tables in Stata. |
||||||||||||||||||||||||||||||||||||||
About the authorMichael Mitchell is a senior statistician working in the area of sleep research as well as working on prevention of child maltreatment with the Children’s Data Network. He is the author of four other Stata Press books: A Visual Guide to Stata Graphics, Fourth Edition, Interpreting and Visualizing Regression Models Using Stata, Data Management Using Stata, and Stata for the Behavioral Sciences. Previously, he worked for 12 years as a statistical consultant and manager of the UCLA ATS Statistical Consulting Group. There he envisioned the UCLA Statistical Consulting Resources website and wrote hundreds of webpages about Stata. |
||||||||||||||||||||||||||||||||||||||
Table of contentsView table of contents >> A.2 More on exporting PDF filesA.2.1 Specifying the table width and relative column widths A.2.2 Adding and customizing text A.2.3 Adding formatted titles and formatted notes A.2.4 Multiple lines of formatted notes A.2.5 Dropping a row A.2.6 Titles, notes, and stars with regression results A.3 More on exporting Excel files A.3.1 Create a simple table; export it to Excel A.3.2 Adding titles and notes A.3.3 Export via putexcel A.3.4 Adding and customizing text B Creating tables of estimation results using etable
B.1 Multiple regression
B.2 Tables based on multiple estimation commands B.3 Multivariate regression C Tips for handling common errors
C.1 Forgetting collect clear
C.2 Forgetting the modify option C.3 Changing the wrong label C.4 Ignoring notes or warnings C.5 Forgetting to display the label D Making reusable code: Nested regression
D.1 Table of model statistics
D.2 Table with regression coefficients and model statistics D.1.1 Attempt 1 D.1.2 Attempt 2 D.1.3 Recap: nestreg1.do D.2.1 Recap: nestreg2.do Subject index (PDF)
|
||||||||||||||||||||||||||||||||||||||