1 item has been added to your cart.
Panel data
Take full advantage of the extra information that panel data provide while
simultaneously handling the peculiarities of panel data. Study the
time-invariant features within each panel, the relationships across panels,
and how outcomes of interest change over time. Fit linear models or nonlinear
models for binary, count, ordinal, censored, or survival outcomes with
fixed-effects, random-effects, or population-averaged estimators. Fit correlated random-effects models. Fit linear
models with high-dimensional fixed effects. Fit dynamic models, vector autoregressive models, or models with endogeneity. Fit Bayesian panel-data models.
Time series
Handle the statistical challenges inherent to time-series
data—autocorrelations, common factors, autoregressive
conditional heteroskedasticity, unit roots, cointegration, and much
more. Analyze univariate time series using ARIMA, ARFIMA,
Markov-switching models, ARCH and GARCH models, and
unobserved-components models. Compare ARIMA or ARFIMA models using AIC,
BIC, and HQIC, and select the best
number of autoregressive and moving-average terms. Analyze multivariate time series using
VAR, structural VAR, instrumental-variables (proxy) structural VAR, VEC, multivariate GARCH,
dynamic-factor models, and state-space models. Compute and graph impulse responses. Estimate IRFs via local projections. Test for unit roots. Perform Bayesian time-series analysis.
Cross-sectional models
Fit classical linear models
of the relationship between a continuous
outcome, such as wage, and the determinants of wage, such as education
level, age, experience, and economic sector.
If your response is
binary (for example,
employed or unemployed), ordinal (education level), count (number of
children), or censored (ticket
sales in an existing venue), don't worry. Stata has maximum
likelihood estimators—probit, ordered probit, Poisson, tobit,
and many others—that estimate the relationship between such
outcomes and their determinants. A vast array of tools is available
to analyze such models. Predict outcomes and their confidence
intervals. Test equality of parameters, or any linear or nonlinear
combination of parameters.
Endogeneity and selection
When explanatory variables are related to omitted observable variables, or
when they are related to unobservable variables, or when there is selection
bias, then causal relationships are confounded and parameter estimates from
standard estimators produce inconsistent estimates of the true relationships.
Stata can fit consistent models when there is such endogeneity or selection—whether your
outcome variable is continuous, binary, count, or ordinal and whether your data are
cross-sectional or panel. Stata can even combine endogenous covariates, selection, and
treatment effects in the same model.
Causal inference/Treatment effects
Estimate experimental-style causal effects from observational data; for
instance, estimate the effect of a job training program on employment or
the effect of a subsidy on production. Fit models for continuous,
binary, count, fractional, and survival outcomes with binary or
multivalued treatments using inverse-probability weighting (IPW),
propensity-score matching, nearest-neighbor matching, regression
adjustment, or doubly robust estimators. Fit models with exogenous or
endogenous treatments. After estimation, test the overlap assumption and
covariate balance. Add endogenous covariates and sample selection to
some treatment-effects estimators. In the presence of group and time
effects, you can use difference-in-differences (DID) and
triple-differences (DDD) estimators. In the presence of high-dimensional
covariates, you can use lasso. If causal
effects are mediated through another variable, use causal mediation with
mediate to disentangle direct
and indirect effects.
Marginal effects and marginal means
Marginal effects and marginal means let you analyze and visualize the
relationships between your outcome variable and your covariates, even
when that outcome is binary, count, ordinal, categorical, or censored
(tobit).
Estimate population-averaged marginal effects or evaluate
marginal effects at interesting or representative values of the
covariates. Analyze the effect of interactions. You can even trace
out the marginal effect over a range of interesting covariate values
or covariate interactions. You can do all of this with marginal
means (sometimes called potential-outcome means), even when your
“mean” is a probability of a positive outcome or a count from a
Poisson model. If you have panel data and random effects, these
effects are automatically integrated out to provide marginal (that is,
population-averaged) effects.
Choice models
Model your discrete choice data. If your outcome is, for instance,
a choice to travel by bus, train, car, or airplane, you can
fit a conditional logit, multinomial probit, or mixed logit model.
Is your outcome instead a ranking of prefered travel methods?
Fit a rank-ordered probit or rank-ordered logit model. Regardless of
the model fit, you can use the margins to easily interpret the
results. Estimate how much wait times at the airport affect the
probability of traveling by air or even by train.
GMM
GMM (generalized method of moments) can be used to fit almost any
statistical model, including both exactly identified and
overidentified estimation problems. Overidentified problems arise
when you have endogeneity, correlation in dynamic panels, sample
selection, and many other situations.
With Stata, you estimate these
models by simply writing your moments and enclosing the parameters in
curly braces. You can easily fit cross-sectional, time-series, panel-data,
or survival-data models and test your overidentifying restrictions.
Demand systems
Fit demand systems to explore consumers' demand for goods and services. Given a
budget and a bundle of goods and services, determine the expenditure and price
elasticities for these goods. Choose between the Cobb–Douglas system, Stone's
linear expenditure system, the translog indirect utility demand system,
the almost ideal demand system (AIDS), the quadratic almost
ideal demand system (QUAIDS), and others.
Machine learning
With machine learning via H2O, you can use ensemble decision trees—random
forests and gradient boosting machines—for regression
and classification. Or use lasso for sparse regression and classification.
Or use Bayesian variable selection or Bayesian model averaging to select
predictors in a linear model.
For causal inference with machine learning, use double-selection lasso,
partialing-out lasso, and double machine learning. You can use PCA or
kmeans, kmedians, or hierarchical clustering for unsupervised learning.
And use search to find community-contributed commands for neural
networks, support vector machines, graphical lasso, text mining, and more.
Programming
Want to program your own commands to perform estimation,
perform data manipulation, or implement other new features?
Stata is programmable, and thousands of Stata users have
implemented and published thousands of community-contributed commands.
These commands look and act just like official Stata commands
and are easily installed for free over the Internet from within
Stata. A unique feature of Stata's programming environment is Mata,
a fast and compiled language with support for matrix types. Of course, it has
all the advanced matrix operations you need. It also has access to
the power of LAPACK. What's more, it has built-in solvers and optimizers
to make implementing your own maximum likelihood, GMM, or other
estimators easier. And you can leverage all of Stata's estimation and
other features from within Mata. Many of Stata's official commands are
themselves implemented in Mata.
PyStata—Python integration
Interact Stata code with Python code. You can seamlessly pass data and results
between Stata and Python. You can use Stata within Jupyter Notebook and other
IPython environments. You can call Python libraries such as NumPy, matplotlib,
Scrapy, scikit-learn, and more from Stata. You can use Stata analyses from
within Python.
Forecasting
Build multiequation models, and produce forecasts of levels, trends, rates,
etc. Whether you have a small model with a few equations or a complete model
of the economy with thousands of equations, Stata can help you build that
model and produce forecasts. Your model can include both estimated
relationships and known identities. You can easily create and compare
forecasts under different scenarios, create static and dynamic forecasts, and
even estimate stochastic confidence intervals. You can create your model by
using an intuitive command syntax or by using the interactive forecasting
control panel.
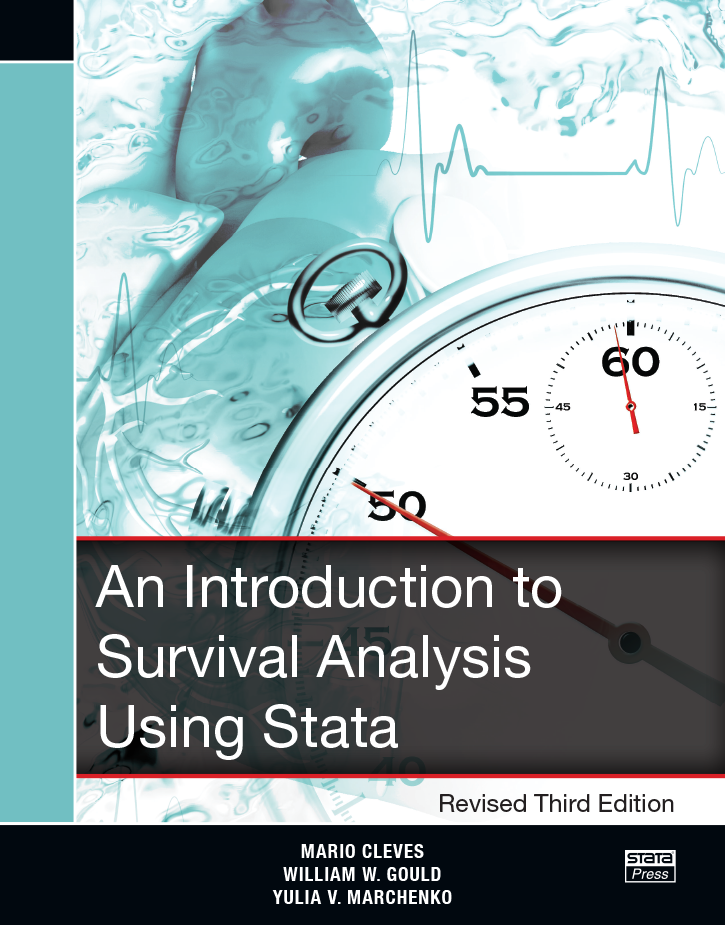
Survival analysis
Analyze duration outcomes—outcomes measuring the time to an event
such as failure or death—using Stata's specialized tools for
survival analysis. Account for the complications inherent in survival
data, such as sometimes not observing the event (right-, left-, and
interval-censoring), individuals entering the study at differing times
(delayed entry), and individuals who are not continuously observed
throughout the study (gaps). You can estimate and plot the probability
of survival over time. Or model survival as a function of covariates
using Cox, Weibull, lognormal, and other regression models. Predict
hazard ratios, mean survival time, and survival probabilities. Do you
have groups of individuals in your study? Adjust for within-group
correlation with a random-effects or shared-frailty model. When you have
interval-censored multiple-event data, you can fit a marginal Cox model. If you have
many potential covariates, use lasso cox and
elasticnet cox for model selection and prediction.
Bayesian analysis
Perform Bayesian econometrics
analysis using one of the Markov chain Monte Carlo
(MCMC) methods. You can choose from various supported models, such as
panel-data, hierarchical, VAR, and DSGE models, or you can even program
your own. Extensive tools are available to check convergence, including
multiple chains. Compute posterior mean estimates and credible
intervals for model parameters and functions of model parameters. You
can perform both interval- and model-based hypothesis testing. Compare
models using Bayes factors. Compute model fit using posterior predictive
values. Generate predictions and forecasts. If you want to account for
model uncertainty in your regression model, use Bayesian model averaging.
Use Bayesian variable selection for linear regression to identify predictors
important to your outcome and perform Bayesian inference.
Survey methods
Whether your data require a simple weighted adjustment because of differential
sampling rates or you have data from a complex multistage survey, Stata's
survey features can provide you with correct standard errors and confidence
intervals for your inferences. Simply specify the relevant characteristics of
your sampling design, such as sampling weights (including weights at multiple
stages), clustering (at one, two, or more stages), stratification, and
poststratification. After that, most of Stata's estimation commands can adjust
their estimates to correct for your sampling design.
Meta-analysis
Combine results of multiple studies to estimate an overall effect. Use
forest plots to visualize results. Use subgroup analysis and
meta-regression to explore study heterogeneity. Use funnel plots and
formal tests to explore publication bias and small-study effects. Use
trim-and-fill analysis to assess the impact of publication bias on
results. Perform cumulative and leave-one-out meta-analysis. Perform
univariate, multilevel, and multivariate meta-analysis. Use the meta suite, or let the Control Panel interface
guide you through your entire meta-analysis.
Automated reporting and customizable tables
Stata is designed for reproducible research, including the ability to
create dynamic documents incorporating your analysis results. Create
Word or PDF files, populate Excel worksheets with results and format
them to your liking, and mix Markdown, HTML, Stata results, and Stata
graphs, all from within Stata. Create tables that compare
regression results or summary statistics, use default styles
or apply your own, and export your tables to Word, PDF, HTML, LaTeX,
Excel, or Markdown and include them in your reports.
Reproducibility
Stata is the only software for data science and statistical analysis
featuring a comprehensive
integrated versioning
that ensures your code continues to run, unaltered, even after updates
or new versions are released. No need to keep around multiple legacy
installations to avoid breaking your system; Stata code from 40 years
ago can still be run without modification. Datasets, graphs, scripts,
programs, and more are 100% cross-platform and backward compatible.
Over many years, Stata has been the one constant in a perpetually changing software toolbox. For me, it remains the fastest and most thorough tool for fully understanding a complex dataset. Plus it’s the easiest tool to extend and customize. I can’t imagine working without it.
— Sean Becketti
Financial industry veteran with three decades of
experience
in academics, government, and private industry
Intuitive and easy to use.
Once you learn the syntax of one estimator, graphics command,
or data manipulation tool, you will effortlessly understand the rest.
Accuracy, reliability, and reproducibility.
Stata is extensively and continually tested.
Stata's tests produce
approximately 7.2 million lines of testing code. Each of
those lines is compared against known-to-be-accurate results
across editions of Stata and every operating system Stata supports to
ensure accuracy and reproducibility, including
integrated versioning
for backwards compatibility.
One package. No modules.
When you buy Stata, you obtain
everything for your statistical,
graphical, and data analysis needs. You do not need to buy separate modules
or import your data to specialized software.
Write your own Stata programs.
You can easily write your own Stata programs and commands. Share them
with others or use them to simplify your work. Utilize Stata's
do-files, ado-files, and Mata:
Stata's own advanced programming
language that adds direct support for matrix programming. You can also
access and benefit from the thousands of existing Stata
community-contributed programs.
Extensive documentation.
Stata offers 36 manuals with more than 19,000 pages of PDF documentation
containing detailed examples, in-depth discussions, references to relevant literature,
and methods and formulas. Stata's documentation is a great place to learn about
Stata and the statistics, graphics, data manipulation, and data science tools you
are using for your research.
Top-notch technical support.
Stata's technical support is known for their prompt, accurate,
detailed, and clear responses. People answering your questions have master's
and PhD degrees in relevant areas of research.
Join us for one of our free live webinars. Ready. Set. Go Stata shows you how to quickly get started manipulating, graphing, and analyzing your data. Or, go deeper in one of our special-topics webinars.
Stata's YouTube has over 300 videos with a dedicated playlist of methodologies important to economists. And they are a convenient teaching aid in the classroom.
;)
Get started quickly at using Stata effectively, or even learn how to perform rigorous time-series, panel-data, or survival analysis, all from the comfort of you home or office. NetCourses make it easy.
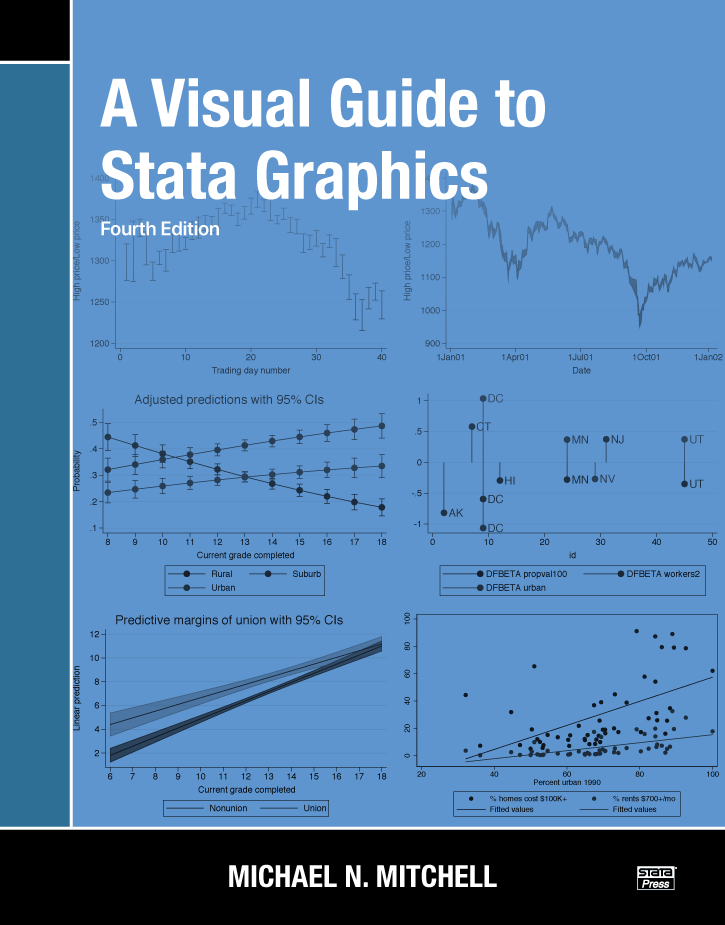
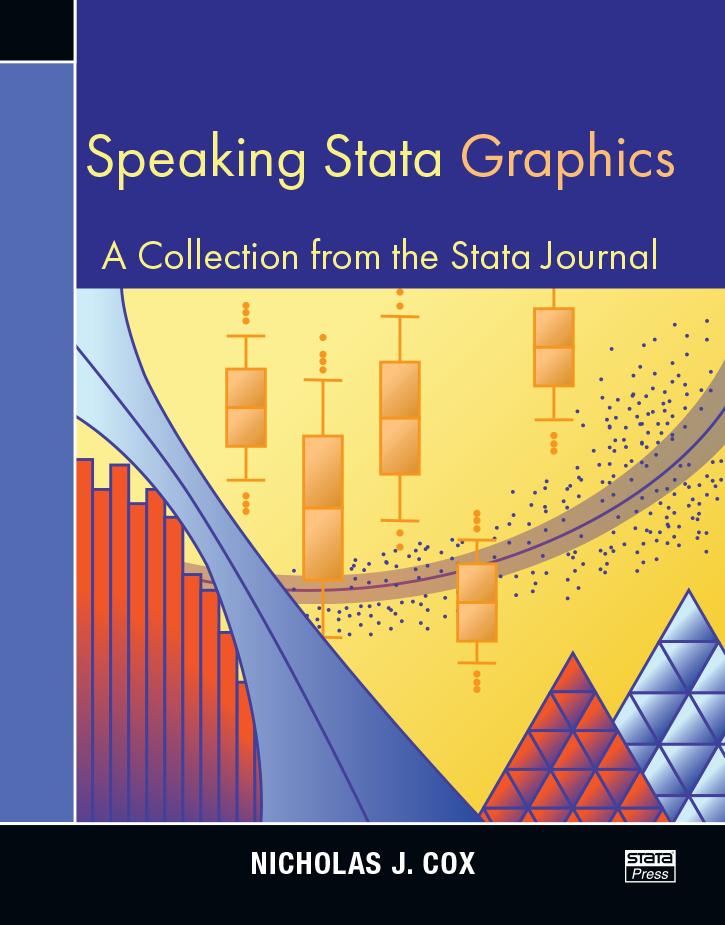
Stata Press offers books with clear, step-by-step examples that make teaching easier and that enable students to learn and economists to implement the latest best practices in analysis.