1 item has been added to your cart.
Data wrangling
Scrape data from the web, import it
from standard formats, or pull it in
via SQL with JDBC or ODBC. Match-merge, link, append,
reshape, transpose, sort, filter.
Stata handles Unicode, frames (multiple datasets in memory), BLOBs,
regular expressions, and more, whether working with hundreds of
thousands or even billions of data points.
Automated reporting and customizable tables
Use Markdown to create Word documents and HTML files with embedded Stata code,
output, and graphs. Automate Word, PDF, or Excel reports with both high-level
export capabilities and low-level fine-grained programmatic access to automate
production of the documents your team needs. Customize tables to
clearly communicate results, and export your tables to Word, PDF, HTML,
LaTeX, Excel, or Markdown. Read more
about Markdown,
about Word Documents,
about PDF documents,
about Excel,
or about customizable tables.
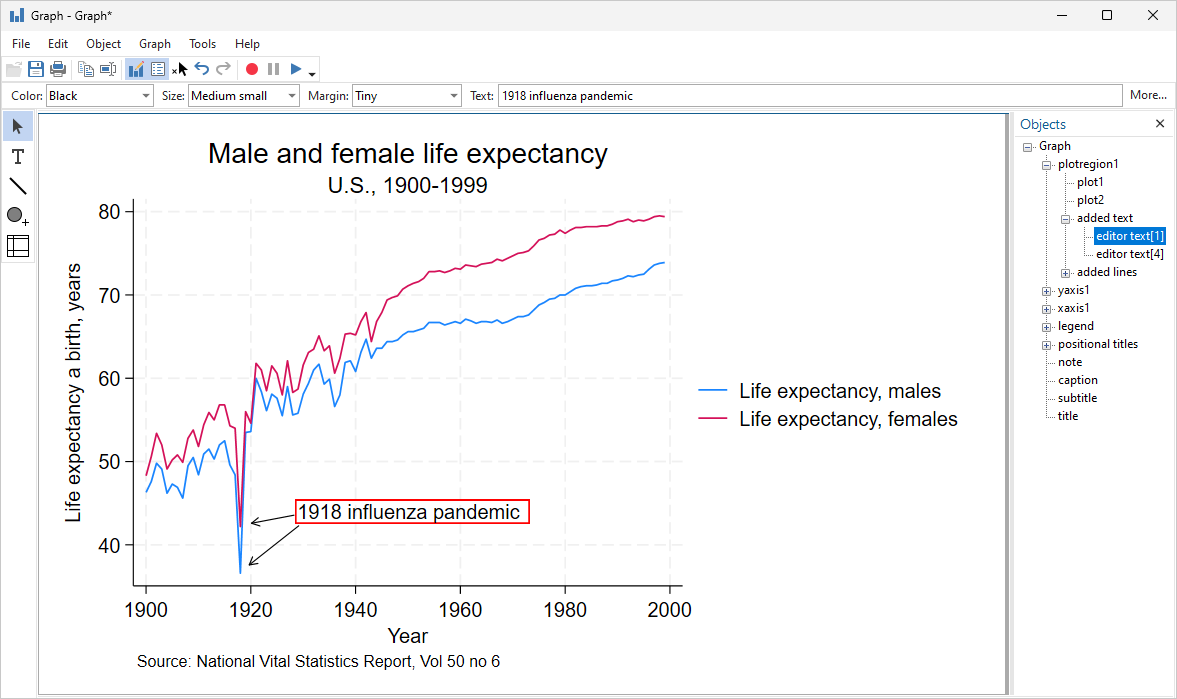
Visualization
Create graphs and customize them programmatically
or interactively with the Graph Editor. Edits
can even be recorded and "replayed" on other
graphs for reproducibility. Export to
industry standard formats suitable for web
(SVG, PNG) or print (PDF, TIFF, EPS, PS).
Programming
Automate your entire workflow with both scripts
and full-blown programming features like classes,
structures, and pointers. A unique feature of
Stata's programming environment is Mata,
a fast and compiled matrix programming language.
Of course, it has all the advanced matrix operations you need.
It also has access to the power of LAPACK. What's more,
it has built-in solvers and optimizers to make implementing
your own estimator easier. And you can leverage all of
Stata's estimation features and other features from within Mata.
PyStata—Python integration
Interact Stata code with Python code. You can seamlessly pass data and results
between Stata and Python. You can use Stata within Jupyter Notebook and other
IPython environments. You can call Python libraries such as NumPy, matplotlib,
Scrapy, scikit-learn, and more from Stata. You can use Stata analyses from
within Python.
Machine learning
With machine learning via H2O, you can use ensemble decision trees—random forests and gradient boosting machines—for regression and classification. Or use lasso for sparse regression and classification. Or use Bayesian variable selection or Bayesian model averaging to select predictors in a linear model. For causal inference with machine learning, use double-selection lasso, partialing-out lasso, and double machine learning. You can use PCA or kmeans, kmedians, or hierarchical clustering for unsupervised learning. And use search to find community-contributed commands for neural networks, support vector machines, graphical lasso, text mining, and more.
Interoperability
Connect to external code via Python, Java, and C++ plugins. Write Python or
Java code directly within your Stata code. Control Stata via Jupyter Notebook,
OLE Automation, or call it in batch mode. Write custom SQL statements with
JDBC and ODBC to extract from or populate databases. Access H2O clusters.
Read more about
PyStata—Python integration,
Jupyter Notebook,
Java integration,
Java plugins,
C/C++ plugins,
H2O integration, and
OLE Automation.
Statistics and modeling
Incorporate state-of-the-art statistical models and results in your
workflow. Find groups in your data using unsupervised techniques
including cluster analysis, principal components, factor analysis,
multidimensional scaling, and correspondence analysis. Understand
your groups even better using latent class analysis.
When your analysis calls for supervised techniques, Stata has
flexible nonparametric methods and an array of
regression models from linear and logistic models to mixture models.
Stata keeps up when your data call for special techniques. You have
access to methods that understand and take advantage of the structure
in time series, panel data, survival data, complex survey data,
spatial data, and multilevel data. Stata provides the most
approachable implementations of Bayesian methods and structural
equation modeling available anywhere. You can request bootstrap
methods for virtually any estimator. When your analysis calls for it,
Stata automates other replication methods and simulations.
Reproducibility
Stata is the only software for data science and statistical analysis
featuring a comprehensive integrated versioning
that ensures your code continues to run, unaltered, even after updates
or new versions are released. No need to keep around multiple legacy
installations to avoid breaking your system; Stata code from 40
years ago can still be run without modification. Datasets, graphs,
scripts, programs, and more are 100% cross-platform and backward compatible.
Intuitive and easy to use.
Once you learn the syntax of one estimator, graphics command,
or data manipulation tool, you will effortlessly understand the rest.
Accuracy, reliability, and reproducibility.
Stata is extensively and continually tested.
Stata's tests produce
approximately 7.2 million lines of testing code. Each of
those lines is compared against known-to-be-accurate results
across editions of Stata and every operating system Stata supports to
ensure accuracy and reproducibility, including
integrated versioning
for backwards compatibility.
One package. No modules.
When you buy Stata, you obtain
everything for your statistical,
graphical, and data analysis needs. You do not need to buy separate modules
or import your data to specialized software.
Write your own Stata programs.
You can easily write your own Stata programs and commands. Share them
with others or use them to simplify your work. Utilize Stata's
do-files, ado-files, and Mata:
Stata's own advanced programming
language that adds direct support for matrix programming. You can also
access and benefit from the thousands of existing Stata
community-contributed programs.
Extensive documentation.
Stata offers 36 manuals with more than 19,000 pages of PDF documentation
containing detailed examples, in-depth discussions, references to relevant literature,
and methods and formulas. Stata's documentation is a great place to learn about
Stata and the statistics, graphics, data manipulation, and data science tools you
are using for your research.
Top-notch technical support.
Stata's technical support is known for their prompt, accurate,
detailed, and clear responses. People answering your questions have master's
and PhD degrees in relevant areas of research.
Join us for one of our free live webinars. Ready. Set. Go Stata shows you how to quickly get started manipulating, graphing, and analyzing your data. Or, go deeper in one of our special-topics webinars.
Stata's YouTube has over 300 videos with playlists for a variety of methodologies important to data scientists. And they are a convenient teaching aid in the classroom.
;)
Get started quickly at using Stata effectively, or even learn how to perform rigorous time-series, panel-data, or survival analysis, all from the comfort of you home or office. NetCourses make it easy.
Stata Press offers books with clear, step-by-step examples that make teaching easier and that enable students to learn and data scientists to implement the latest best practices in analysis.