
← See Stata 19's new features
Highlights
View data from multiple frames in the Data Editor
Easily make changes in one frame, two frames, or more, without having to worry which frame is the working frame
Rename, copy, drop, and create a new frame from the Frames window
File, Data, and Tools menus work within the context of the focused frame
Copy data from one frame and paste into another frame
Save a snapshot of data in one frame, and restore the snapshot in another frame
See more data management features
With Stata's data frames, you can work with multiple datasets in memory. Now you can view data from multiple frames in the Data Editor. This allows you to simultaneously view multiple datasets, easily make changes to these datasets, copy from one frame and paste into another, and much more. The data from each frame will be displayed on a separate tab, and you can control which frames are displayed and in what order. This feature is a part of StataNow™.
Many times, it is useful to view data from multiple files at once. For example, you might be looking at a dataset of birth rates for a hospital in a small town and want to refer to the birth rates for that state or region that are stored in another dataset. You might be working with financial data for a specific county and notice that the expenses are rather large; you then want to view datasets containing expenses for other counties in that area for comparison. Or you might want to browse datasets of sales for different branches of a retail company. In StataNow, you can view data from these files simultaneously in the Data Editor.
Suppose we are working on a campaign to spread awareness about the prevalence of heart attacks and the long-term risks associated with diabetes. We have data from the Second National Health and Nutrition Examination Survey (NHANES II) (McDowell et al. 1981), and we would like to see what percentage of individuals in each age group have experienced a heart attack and what percentage have diabetes. We are also interested in how the prevalence changes across rural and urban communities in each region of the US.
We begin by loading the dataset in its entirety. Unless we specify otherwise, any dataset that we open will be stored in a frame called default. We then open the Data Editor by typing edit.
. webuse nhanes2

. edit
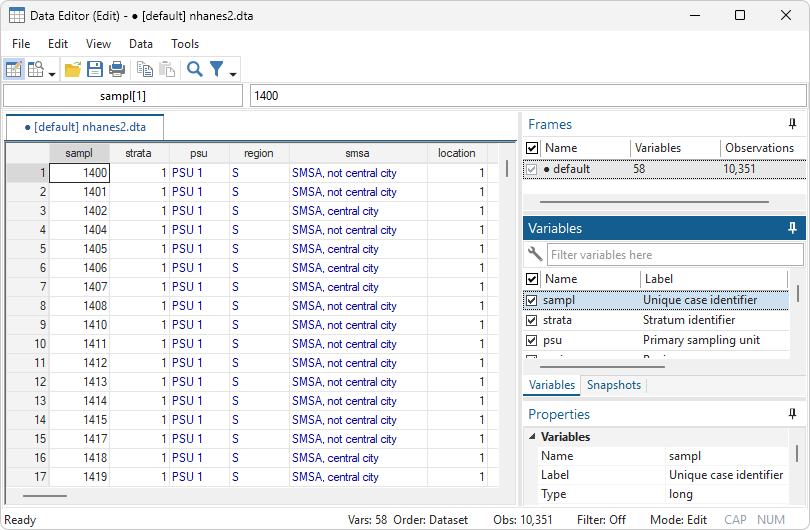
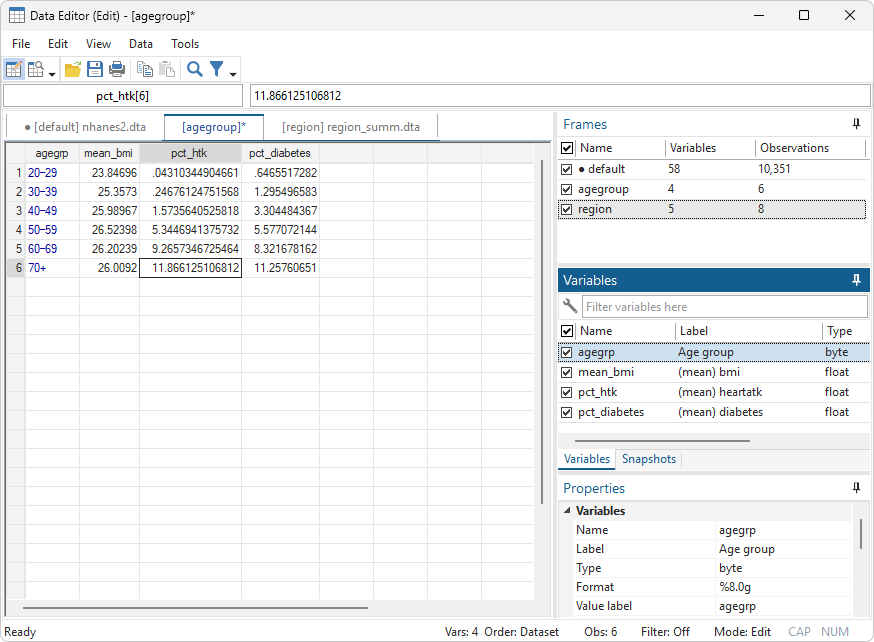
In the Data Editor, a solid dot (●) is placed next to the current working frame. Currently, it is our only frame. Next, we use collapse to create the dataset of summary statistics for each age group. We create a frame called agegroup and then load the dataset and collapse it. We use the frame prefix to apply these changes to the data in the frame agegroup.
. frame create agegroup
. frame agegroup: webuse nhanes2
. frame agegroup: collapse (mean) mean_bmi=bmi pct_htk=heartatk pct_diabetes=diabetes, by(agegrp)
. frame agegroup: replace pct_htk = 100*pct_htk
. frame agegroup: replace pct_diabetes = 100*pct_diabetes
Next, we create a frame called region; in this frame, we load the dataset and compute the same summary statistics but for the rural and urban communities in each region:
. frame create region
. frame region: webuse nhanes2
. frame region: collapse (mean) mean_bmi=bmi pct_htk=heartatk pct_diabetes=diabetes, by(region rural)
. frame region: replace pct_htk = 100*pct_htk
. frame region: replace pct_diabetes = 100*pct_diabetes
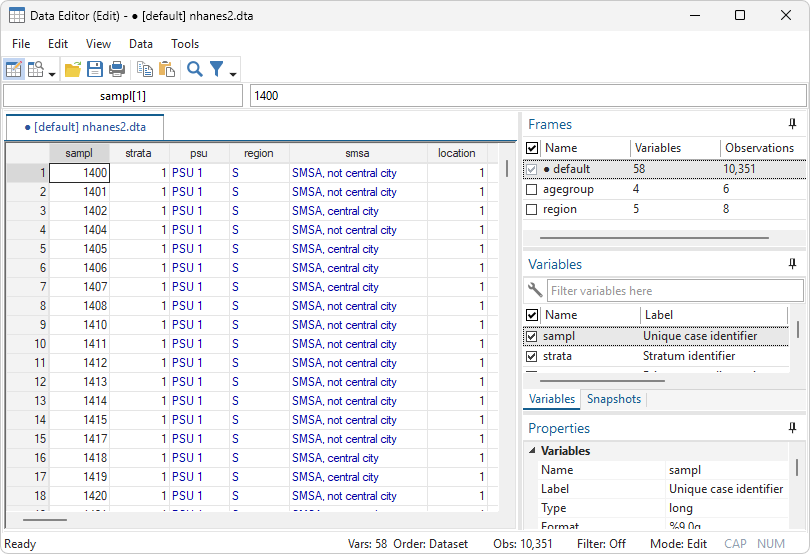
The new frames are not displayed by default, with good reason. Stata supports up to 100 frames, and if we had 100 frames, we most likely would not want to view all 100 frames at once. In the Frames window, we right click and select Show all frames. Alternatively, to only display certain frames, we would check the box next to the frame names. Now we have tabs for all three frames. In the region frame, we can see what percentage of individuals in rural and urban areas have had a heart attack, separately for each region. And similarly for diabetes.
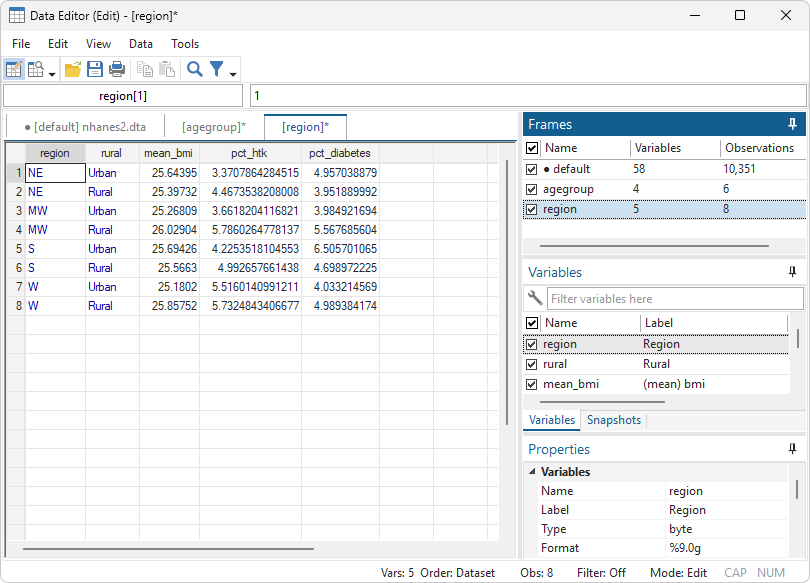
Any changes we make in the Data Editor will apply to the currently focused (selected) frame, which is currently region. We can sort the data, we can click on the filter icon to filter observations, and we can save a snapshot of the data.
In the Data Editor, menu items in the Data menu are frame-context aware. In other words, the resulting dialogs will be aware of the frame we are working on.
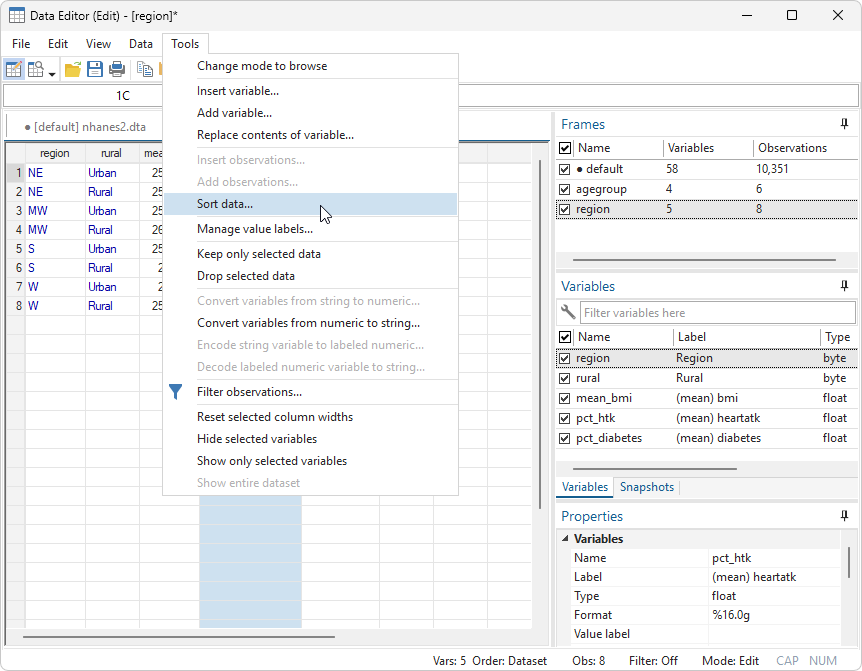
Menu items in the Tools menu are frame-context aware and grid-context aware. In other words, the resulting dialogs will be aware of the frame we are working on and the data we have selected in the grid. For example, below we click on the column for variable pct_htk.
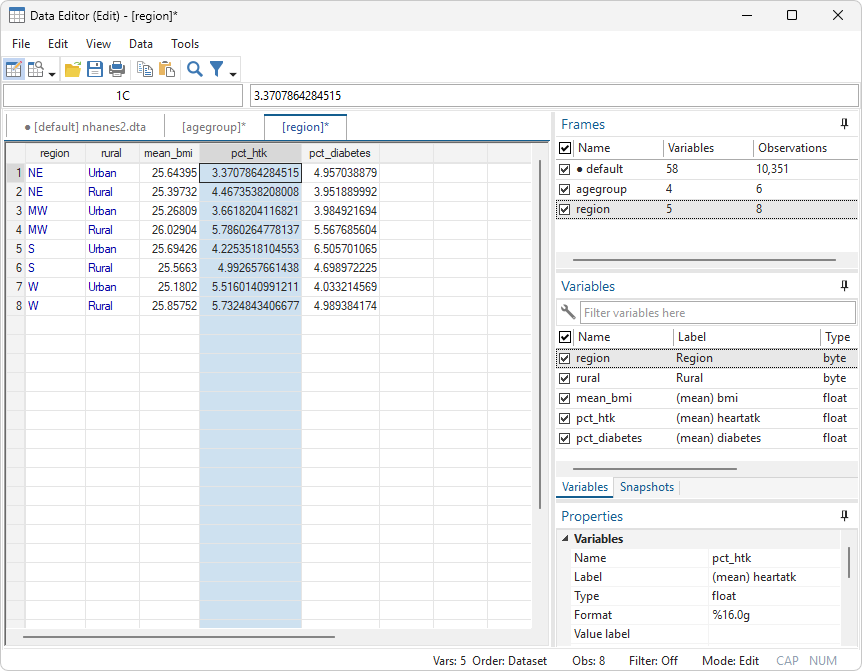
We want to sort the data in ascending order of heart attacks, so we click on Tools > Sort data....
The dialog for sort automatically populates with the variable name we selected. Also, note that the dialog includes the frame name in the title; this is a reminder that we are making changes in the frame called region.
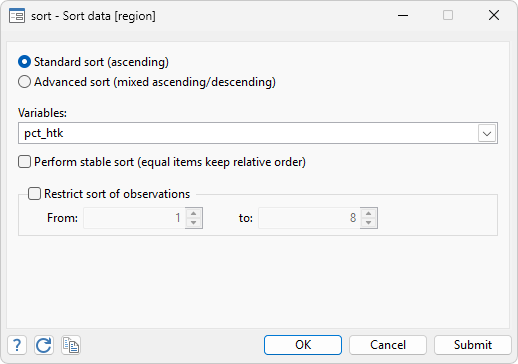
We click on OK.
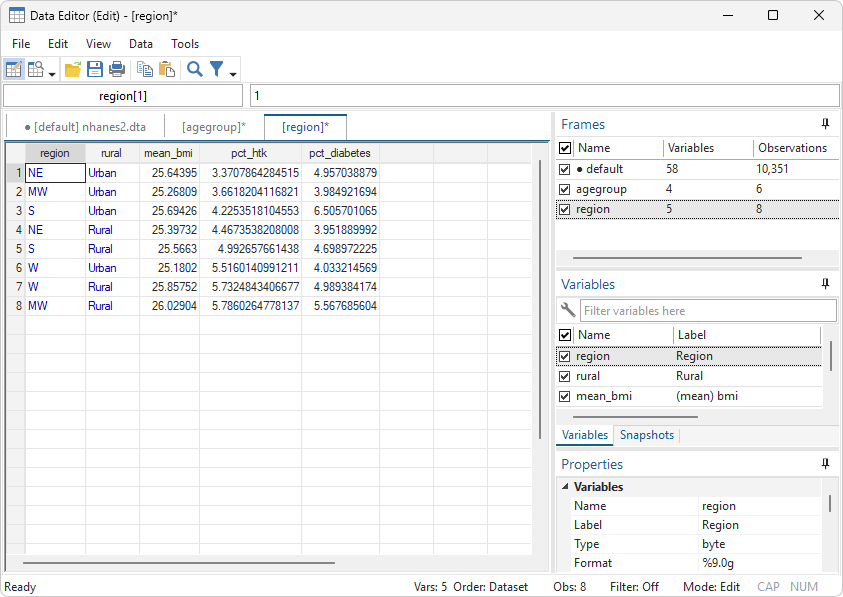
We see that rural communities in the Midwest have the highest percentage of heart attacks.
An asterisk is placed next to the frame names agegroup and region, because we have modified the data in these frames but haven't saved the changes. To save the data in the frame region, we click on the Save icon. We get the following warning.
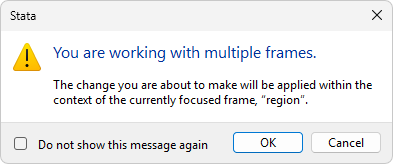
Because we are working with multiple datasets, Stata prompts us to confirm that our change is intended for the frame we have currently selected. We click on OK and then provide the dataset name region_summ.dta in the resulting dialog. In the Results window, we see
. frame region: save "/home/StataNow/region_summ.dta"
Next, we want to look at the summary statistics by age group. We click on the tab agegroup. And the age group with the highest percentage of heart attacks is the 70+ group.
This is just one example of how it can be useful to work with multiple frames in the Data Editor. You may find that other features are more useful for your work; for example, you might benefit from dragging the tabs to reorder them, taking snapshots of different frames, or using the menu in the Frames window to change the working frame.
McDowell, A., A. Engel, J. T. Massey, and K. Maurer. 1981. “Plan and operation of the Second National Health and Nutrition Examination Survey, 1976–1980.” In Vital and Health Statistics, ser. 1, no. 15. Hyattsville, MD: National Center for Health Statistics.
Read more about viewing and editing data from multiple frames in the Data Editor; see [GS] 6 Using the Data Editor (in [GSW], [GSM], or [GSU]) for a tutorial discussion of the Data Editor.
Learn more about Stata's data management features.
View all the new features in Stata 19 and, in particular, new in data management.


