


Join us in Vancouver for the 2026 Canadian Stata Conference! Enroll in our preconference workshops on 5 November, then enjoy a full day of Stata presentations and networking opportunities, followed by the users' dinner at Riley's Fish and Steak on 6 November.
Enjoy the stunning natural beauty of Vancouver by biking Stanley Park's seawall, exploring Grouse Mountain's views, or taking in waterfront scenery at Canada Place. Whether you're dining at one of the 12 Michelin-starred restaurants, exploring Granville Island Market, or wandering through the unique shops in historic Gastown, Vancouver offers a stunning combination of vibrant urban culture, exciting culinary experiences, and beautiful natural scenery for you to enjoy while connecting with fellow Stata users from across Canada and the world.
In the difference-in-differences literature, the average treatment effect on the treated (ATT) is typically considered identified under the conditional parallel trends (CPT) assumption, often without recognizing the overly restrictive nature of the covariate structure it imposes. In practice, conventional methods for assessing the CPT's plausibility rely on the assumption that covariates affect untreated potential outcomes through common coefficients across regions and periods, known as the common causality of covariates assumption (Karim and Webb 2024). Within this conventional framework, Karim and Webb (2024) demonstrate that CCC is a necessary condition for CPT. Intersection parallel trends (IPT) extend this framework by allowing more flexible incorporation of covariates, potentially revealing plausible parallel trends that traditional methods might miss. The CCC is no longer a necessary condition for intersection parallel trends (IPT), because it allows covariate effects to vary. This presentation introduces a formal statistical test for the CCC assumption, checking whether covariate coefficients are stable across regions, periods, or both. The CCC test employs a sequential F test to examine homogeneity, region-specific variation, time-specific variation, or combined variation. In the first stage, it assesses the equality of covariate coefficients across all untreated region-period cells. If rejected, the second-stage tests evaluate region and time variation separately, using Holm’s step-down procedure to control the family-wise error rate. This decision rule helps researchers choose the appropriate DID-INT model. We also provide a Stata program that automates CCC testing and suggests the best DID-INT specification. Although direct testing of parallel trends is not statistically testable, the CCC test offers guidance on selecting a specification likely to uphold intersection parallel trends, thereby yielding consistent ATT estimates.
Researchers routinely estimate costs over a lifetime or an episode, for example, expenditures after an illness. Cost data are often right-censored because of death or end of either follow-up or episode. Basu and Manning (2010) introduced an estimator that extended the existing class of two-part models to accommodate noninformative right-censoring with continuous death and censoring times. Their three-part estimator combines a parametric survival model with person-interval two-part cost models. The estimator is stable when censoring is heavy and costs are skewed with many zeros. Inverse-probability weighting methods (Bang and Tsiatis 2000; Lin 2000) become unstable in these conditions. The estimator also decomposes covariate effects on cumulative cost into effects on survival and effects on the intensity of utilization. I introduce threepm, a Stata command implementing the Basu and Manning estimator. threepm reports cumulative marginal effects and cost and decomposes between-group differences into a rate of accumulation component and a survival component. It accommodates equal or unequal interval lengths, different rates of cost accumulation during the end-of-life window, a choice of survival distributions and of cost-model families and links, and person-clustered bootstrap inference, with companion commands for specification tests, marginal effects, and plotting.
Prior research has documented associations between parenting, family, and neighborhood contexts and child behavior problems, but many findings rely on analytic approaches that are limited in their ability to account for stable family and background characteristics. Thus, the causal strength of these associations remains uncertain. This presentation examines the extent to which parenting, family, and neighborhood factors were associated with child externalizing and internalizing behavior problems using methods designed to strengthen causal inference. Using longitudinal panel data from N = 2,701 families in the future of families and child well-being study, I estimated fixed-effects, random-effects, and correlated random-effects models allowing us to compare between-family and within-family estimates while accounting for observed and unobserved time-invariant heterogeneity. Some of these models have not been previously used in analyses of parenting and child development. Fixed-effects and random-effects models are long-standing in Stata, but correlated random effects are newer to Stata. Similarities across these models are discussed. Across models, parental spanking was consistently associated with higher levels of externalizing and internalizing behavior problems, whereas increases in caregiver warmth were associated with lower internalizing behavior problems. Findings support interventions and policies aimed at reducing physical punishment and increasing parental warmth.
In India, there are many low-resource areas where pregnant women often have ≤3 ANC visits, which can lead to missed complications. Emergency medical services (EMS) transport programs were launched to help pregnant women reach healthcare facilities quickly. Research showed that these programs have not significantly reduced early neonatal deaths. To see how the number of ANC visits relates to early neonatal mortality, a secondary analysis was performed. Methods: The study included 1,431 live births from February to April 2014 among mothers who used EMS transport. Stillbirths and incomplete records were excluded during data management. Mothers' ANC visits, divided into two groups as ≤3 and ≥4, align with the minimum requirement of the WHO guidelines. Stata v19 BE is used for statistical analysis with multivariable logistic regression. The adjusted odds ratios had no significant changes in neonatal mortality on delivery method, place of delivery, or region. Results: Among mothers with minimal ANC (1–3 visits), early neonatal mortality was 7.9% (89 out of 1,128), whereas it was 1.6% (5 out of 303) among those with 4 or more visits. The unadjusted odds ratio was 5.3 (95% CI 2.1–13.2). Even after controlling for other factors, not receiving the recommended amount of antenatal care (ANC) remained associated with a higher risk.
This talk introduces a suite of new commands in Stata for financial statistics. These new commands are finreturns for easily building various types of asset returns from prices; finportfolio for constructing portfolios; finsummarize for computing summary statistics; finregress for running capital asset pricing model and Fama–MacBeth regressions; and finvalrisk for evaluating historical and model-based value at risk. I combine these commands with Stata's extensive time-series toolkit to demonstrate a workflow for analyzing financial data.
Energy efficient or carbon efficient? Examining building performance in British Columbia using Stata
Harmeet Sond, University of British Columbia
View
We often assume if a building uses energy efficiently, it must be better for the environment, but the relationship between energy use and carbon performance is not always clear. This matters when cities are deciding where to invest, because relying on energy metrics alone could lead to substantial capital investments without achieving the expected carbon reductions. That brings up key questions: To what extent do energy use intensity (EUI) and greenhouse gas intensity (GHGI) tell the same story about building performance, and what building characteristics help explain differences between the two? Using public data from Building Benchmark BC, I will examine factors such as building age, property type, floor area, location, and heating fuel sources. Stata will be used to organize the data, visualize patterns, estimate regression models for EUI and GHGI, and run adjusted predictions to compare how building characteristics are associated with each metric. These analyses will highlight where energy and carbon performance may align, where they diverge, and which factors may explain those differences. Ultimately, the project demonstrates how Stata turns real building data into clear evidence to help policymakers and owners target the right buildings, refine decarbonization priorities, and make smarter climate choices in British Columbia.
Impact of physical infrastructure on children education in Pakistan
Urooj Chandani, University of California San Diego
View
Given this background, this presentation will try to address the following two research questions:
The study utilizes ordinary least-squares and ordered probit regressions for analyzing the conditional correlation for the above two questions across 161 districts of Pakistan, the smallest functional unit of local governance. For the outcome variable educational status of the child, the predictor variables for school characteristics of boundary wall, bathroom, and school furniture are statistically significant. For parental education, both father's and mother's education are statistically significant. Student characteristics of age, gender and overall interaction are also statistically significant. For the outcome variable basic learning levels, reading in local and national language, the predictor variables for school characteristics of furniture and internet are statistically significant. For parental education, both father's and mother's education are statistically significant. Student characteristics of age and the interaction between age and gender are also statistically significant.
Generalized estimating equations for repeated postoperative pain scores in Stata: Application to a randomised trial of intravenous methadone in cardiac surgery
Veronica Ka Wai Lai, SickKids Research Institute
View
Postoperative pain after cardiac surgery remains substantial despite opioid administration and trials in this field typically generate repeated, within-patient correlated pain measurements that require appropriate longitudinal analysis. We report the application of Stata to a single-center, double-blind randomized controlled trial comparing intravenous methadone with morphine (0.2 mg/kg at induction of anaesthesia) in 80 adults undergoing cardiac surgery with cardiopulmonary bypass. Numerical rating scale pain scores at rest and on coughing were assessed at six time points up to 72 hours after tracheal extubation. Data were restructured with reshape and declared with xtset. Generalized estimating equations were fitted using xtgee with family(gaussian), link(identity), corr(exchangeable), and vce(robust), with the group-by-time interaction specified in factor-variable notation (i.group##i.time) and tested jointly using testparm. Predictive margins with 95% confidence intervals were estimated using margins and displayed with marginsplot. Methadone was associated with lower pain scores at rest (coefficient −2.24, SE 0.49) and on coughing (coefficient −2.16, SE 0.50), with a significant group-by-time interaction at rest (χ2 17.87 on 5 df). Median 24-hour morphine consumption was 9 mg versus 24 mg in the methadone and morphine groups, respectively. This workflow provides a transparent, reproducible framework for analyzing repeated-measures outcomes in perioperative trials.
Building household wealth indices in Stata: A reproducible workflow for measuring health inequalities in low-resource settings case study: Cervical cancer diagnosis in Mozambique
Francisco Azevedo-Fernandes, Technical University of Mozambique
View
Measuring socioeconomic position remains a major challenge in epidemiologic research conducted in low-resource settings, where informal employment, remittances, seasonal income, cash-based economies, and limited financial reporting reduce the reliability of reported household income. Asset-based household wealth indices provide a more stable measure of long-term socioeconomic position and are widely used to investigate health inequalities when direct income measures are unavailable. This presentation demonstrates a reproducible Stata workflow for constructing and applying an asset-based household wealth index using cervical cancer diagnosis at the oncology department of Maputo Central Hospital, Mozambique's largest national referral hospital and a major oncology referral center in Sub-Saharan Africa, as a case study. The workflow includes data cleaning and recoding; construction of binary household asset variables; principal component analysis (PCA); assessment of sampling adequacy using the KMO statistic and Bartlett's test; generation of standardized wealth scores and wealth quintiles; and multivariable logistic regression with robust standard errors to examine associations with late-stage diagnosis. Practical approaches for handling missing data, producing publication-ready tables and figures, documenting reproducible analytical workflows, and interpreting findings for epidemiologic and health equity research are also presented. Moving beyond disease-specific findings, this presentation showcases a complete, reproducible Stata workflow, from data preparation and wealth index construction to multivariable modeling and publication-ready outputs. The methods are readily transferable to studies of health inequalities across diverse diseases and low-resource settings, providing researchers with practical tools for generating robust, transparent, reproducible, and policy-relevant evidence.
Debt repayments of older adults
Anson Ho, Toronto Metropolitan University
View
We examined the effect of an unexpected one-time taxable grant payment on credit card use among older seniors. We found that the grant payment provided transactors with additional income and liquidity, making them less likely to incur credit card debts. Revolvers exhibited heterogeneous responses depending on the size of their revolving balances. Our findings provide new evidence on the financial behavior of older individuals approaching the end of their lives.
This presentation introduces npmergersim, a community-contributed command for merger simulation in differentiated-product markets when price data are unavailable, confidential, or highly aggregated. The command implements the method developed in Aguirregabiria, Clark, and Souza-Rodrigues (2026), which substitutes Bertrand pricing equations into the demand system to obtain a set of equilibrium conditions in which market shares are the only endogenous variables. This eliminates the need for price data to identify demand substitution patterns, price-cost margins, profits, consumer surplus, and merger effects. npmergersim builds directly on the mergersim command of Björnerstedt and Verboven (2014), extending it along several dimensions: estimation and counterfactual simulation using market shares alone; alternative models of firm conduct, including collusive and conduct-parameter specifications; and quantity competition as an alternative to Bertrand pricing. The command also provides a built-in specification test that compares estimates obtained with and without price data, allowing researchers to assess whether observed prices are contaminated by economically meaningful measurement error. I illustrate the command using data from the European automobile industry, replicating the merger simulation in Björnerstedt and Verboven (2014) without relying on price information.
This presentation examines how market concentration and counterfactual chain consolidation affect prices, quality, markups, and consumer welfare in Pennsylvania’s nursing home industry during 1997–2014, emphasizing differences between for-profit and nonprofit facilities. First, it investigates the relationship between concentration, private-room prices, and quality under independent-facility and chain-adjusted ownership specifications, addressing concentration endogeneity through two-step system GMM with deep-lag instruments. The estimates generally indicate a positive concentration-price relationship, while the evidence for quality remains mixed and often statistically insignificant. Alternative concentration measures and market definitions, evaluated using leave-one-out instruments, generally support this positive price relationship. Second, the study estimates standard logit and full random-coefficients demand models and recovers marginal costs and markups using Bertrand–Nash pricing conditions. The full random-coefficients model yields an average markup of $43.48 and marginal cost of $181.95, compared with $122.05 and $107.40, respectively, under standard logit. Nonprofit facilities face more price-elastic demand and have higher estimated marginal costs. Finally, using the full random-coefficients estimates, the analysis simulates chain mergers, subsequent acquisitions, and chain dissolution. Across three consolidation scenarios with homogeneous acquisitions, average prices increase by $10.18, $9.69, and $8.34 per patient day, while chain dissolution reduces prices by $5.42. Heterogeneous acquisition simulations indicate that target ownership, size, and age influence outcomes, with nonprofit targets generally generating larger price increases and consumer welfare losses than comparable for-profit targets. Overall, the findings suggest that consolidation outcomes depend on both chain ownership structure and the scale and characteristics of subsequent acquisitions.
Estimating competition using the Boone index requires the integration of multiple econometric techniques, including stochastic frontier analysis, translog cost modeling, and dynamic panel estimation. This presentation demonstrates a reproducible Stata workflow for measuring competition in the global microfinance sector using panel data from the microfinance information exchange (MIX) and the World Bank's world development indicators for the period 2010–2019. The analysis illustrates how Stata can be used to estimate a translog cost function through stochastic frontier analysis, derive institution-level marginal costs, and subsequently estimate Boone coefficients using a two-step generalized method of moments (GMM) framework. The presentation further demonstrates the use of Stata for panel-data management, model estimation, diagnostic testing, and graphical visualization of competition dynamics across countries and over time. As an empirical application, the proposed workflow is used to examine competition across microfinance institutions operating in developing economies. The results reveal predominantly negative Boone coefficients for prolonged periods in most upper and lower developing countries, indicating sustained competitive pressures, while several lower and least developed economies exhibit weaker competition as reflected by positive Boone coefficients. India demonstrates consistently strong competition throughout the study period relative to its peer economies, although an anomalous positive Boone coefficient in 2016 suggests a temporary decline in competitive intensity. Graphical analyses generated in Stata further illustrate the evolution of competition across different country groups, highlighting heterogeneous competitive dynamics associated with varying levels of economic development. Beyond its empirical findings, the presentation provides Stata users with a practical framework for implementing advanced competition analysis by integrating stochastic frontier estimation, translog cost modeling, dynamic panel GMM estimation, and reproducible visualization techniques within a single analytical workflow. The methodology is readily adaptable to other industries and countries where competition measurement using firm-level panel data is of interest.
The increasing complexity of modern datasets has heightened the demand for robust, reproducible, and efficient statistical methodologies. This presentation explores the application of Stata in addressing contemporary challenges in data management, statistical modeling, visualization, and reproducible research across diverse disciplines. I demonstrate the application of Stata for analyzing and forecasting tourism demand using modern time-series techniques. The analysis employs an ARIMA model to capture historical trends, seasonality, and temporal dependence in tourist arrivals. The modeling process includes data visualization, stationarity testing using the ADF test, model identification through ACF and PACF plots, parameter estimation, diagnostic checking, and out-of-sample forecasting. Model performance is evaluated using forecasting accuracy measures such as RMSE and MAPE. The study highlights Stata's capabilities for reproducible time-series analysis and demonstrates how ARIMA-based forecasting can provide reliable evidence to support tourism planning and decision-making under changing economic and seasonal conditions. The model ARIMA \((p,\; d,\; q)\), where \(\phi (B)(1-B)^{d}Y_{t}=\theta (B){\varepsilon }_{t}\),\(\ Y_{t}\) represents tourist arrivals at time \(t\), \(B\) is the backshift operator, \(\phi(B)\) is the autoregressive polynomial, \(\theta(B)\) is the moving average polynomial, and \({\varepsilon }_{t}\) denotes white-noise errors.
Somewhere right now, a student is submitting a do-file they didn't write, and it runs. Somewhere else, an analyst is trying a regression option that doesn't exist. Welcome to Stata, analysis, and teaching in the age of AI. This talk takes a practitioner's tour of what AI tools do well in the Stata workflow, such as drafting code, translating from R or SPSS, documenting do-files, and explaining output. It also covers where they go quietly (or not so quietly) sideways: invented options, plausible-but-wrong syntax, and analytic choices nobody asked for. Drawing on my experience in government research, academic research, research data centers, and the classroom, it then asks the harder question: what should we teach, and what is the analyst's role when the do-file writes itself? The answer isn't a ban. It's a shift from writing code to verifying it, so students and applied analysts learn to check, annotate, and defend every line. The guiding principle is pure Stata: trust, but assert. Bring your questions; AI won't be answering them.
Contribute to the Stata community by sharing your feedback with StataCorp's developers. From feature improvements to bug fixes and new ways to analyze data, we want to hear how Stata can be made better for our users.

Learn from Stata experts at our preconference workshops on 5 November:
5 November | 10:00 a.m.–12:00 p.m.
Jeff Pitblado, Executive Director, Statistical Software
Tables are used by practically every researcher—don't miss the opportunity to learn Stata's official commands for building tables, and get the tools to construct almost any table in Stata.
5 November | 1:00–3:00 p.m.
Aram Dallakyan, Senior Statistician and Software Developer
Machine learning (ML) is a powerful tool for modeling complex data and providing accurate predictions. This workshop aims to provide a practical guide to explainable machine learning (XML) and will cover different methods for explaining predictions.
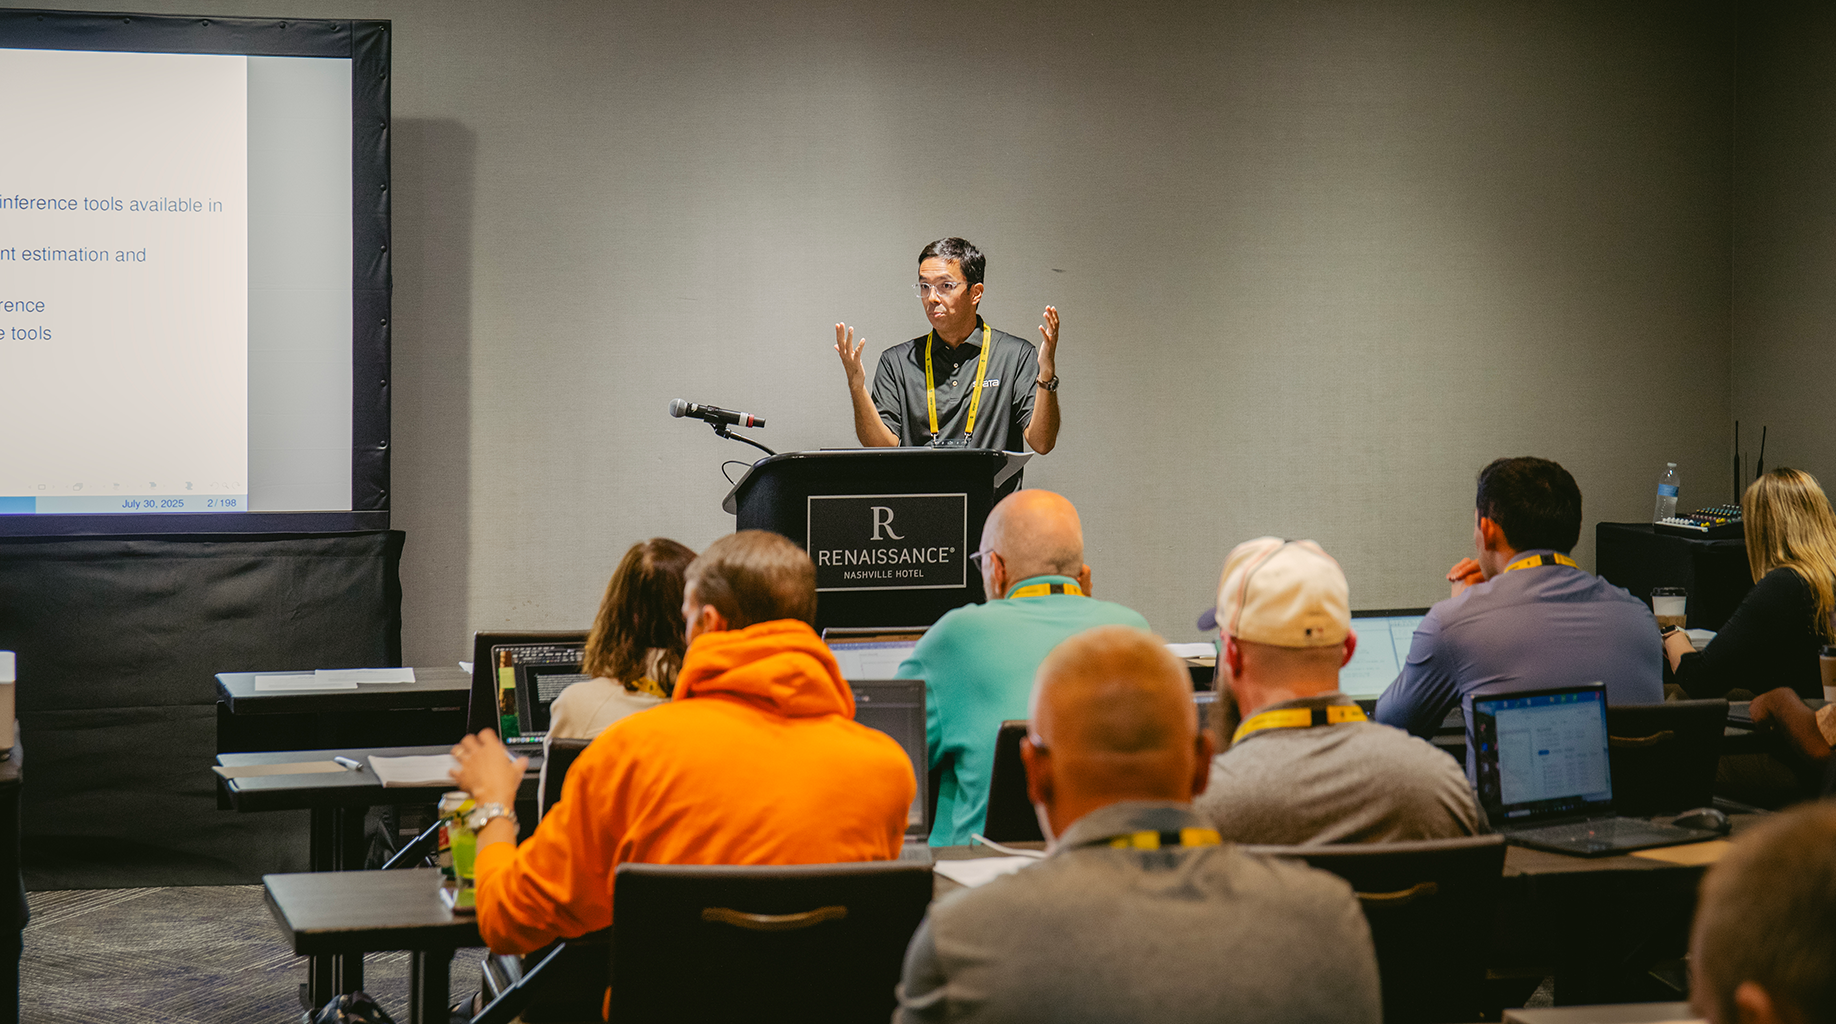
The scientific committee is responsible for the Canadian Stata Conference program. With submissions encouraged from both new and longtime Stata users from all backgrounds, the committee will review all abstracts in developing an exciting, diverse, and informative program. We look forward to seeing you in Vancouver!






Workshop 1: Tables
Professional: $45
Student: $25
Workshop 2: ML
Professional: $45
Student: $25
Both workshops
Professional: $75
Student: $40
Add options during registration
Users' dinner
$55
Stata Conference attendees are invited to join us for our users’ dinner on Friday, 6 October after the close of the conference. Seating for the users' dinner is limited and you must register to attend.
Add this option during registration.
Stata Conference attendees are invited to join us for our annual post-conference users' dinner at Riley's Fish & Steak on Friday, 6 November at 6:30 p.m. Enjoy a completely chef-driven menu from seafood towers that surprise and delight to the highest-quality steak and chops. Riley’s is a Vancouver destination dining experience.

Riley's Fish & Steak
200 Burrard St.
Vancouver, BC, V6C 3L6
(604) 629-8800
University of British Columbia
5959 Student Union Blvd
Vancouver, BC, Canada V6T 1K2
The conference venue and hotel are located at the University of British Columbia. Use the link below to reserve a room directly with the university.
Have questions about the Stata Conference? Our FAQs have you covered. Discover important details on registration, logistics, and more.
Expand all descriptions
The 2026 Canadian Stata Conference will be held between 8:00 a.m. and 5:00 p.m. PST on Thursday, 5 November, and Friday, 6 November, at the University of British Columbia. Everyone is also invited to attend our preconference workshop on Thursday and our annual users' dinner on Friday night. Accomodations at UBC can be booked directly. More details will be available soon. See below to sign up for alerts.
The Stata Conference is open to users of all disciplines and experience levels, bringing together a unique mix of experts, professionals, and students. You will hear from students, Stata users at the top of their fields, and Stata's own researchers and developers. Presentation topics will include new community-contributed commands, methods and resources for teaching with Stata, new approaches to using Stata together with other software, and much more. Anyone interested in Stata is welcome to attend.
Yes! We encourage submissions from students at all levels and are happy to include accepted presentations to the program and poster session.
Yes! The Stata community is full of users from all disciplines, including people you may have met online but would like to meet in person. There will be breaks between sessions where you can take a moment to talk to the people around you, a poster session with encouraged discussion and feedback with presenters, and an open panel discussion where you can ask questions and share feedback with Stata developers.
Everyone is also invited to join an optional users' dinner at Riley's Fish and Steak at 6:30 p.m. Friday night.
Want to start socializing now? Follow @Stata on X. Throughout the conference, we will be live tweeting using the conference hashtag #StataCanada2026.
The conference presentations will not be recorded, but proceedings and slides will be made available on this page in the following weeks after the conference.
Be the first to receive notifications regarding presentation submissions, conference agenda, registration, and lodging information for the 2026 Canadian Stata Conference.