1 item has been added to your cart.
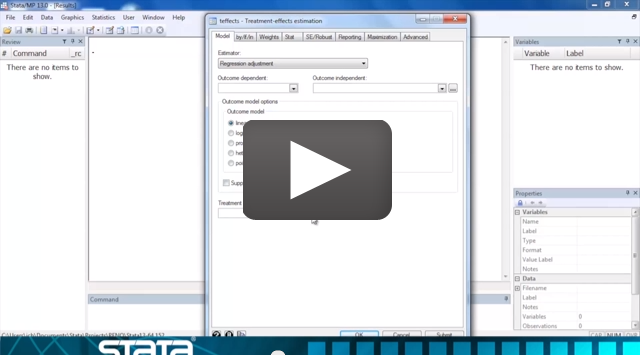
Treatment effects |
|
Treatment effects measure the causal effect of a treatment on an outcome.
A treatment is a new drug regimen, a surgical procedure, a training program, or even an ad campaign intended to affect an outcome such as blood pressure, mobility, employment, or sales.
In the best of worlds, we would measure the difference in outcomes by designing an experiment that assigns subjects randomly to the treatment and the control group.
We can't always do that. When we need to make do with observational data—when the subjects themselves choose whether to be treated or the choice is otherwise nonrandom—we need more statistical machinery.
teffects provides that machinery.
Say we have a training program in which participants enroll voluntarily. In the raw data, participants do poorly relative to nonparticipants, even after the training. Even so, the training program might have improved their outcomes—say, hourly wages—over what they would have been.
There are different treatment-effects estimators for different situations.
When we know the determinants of participation, the appropriate estimators include IPW and propensity-score matching. We might type
. teffects ipw     (wage) (trained x1 x2)
. teffects psmatch (wage) (trained x1 x2)
When we instead know the determinants of outcome, the appropriate estimators include regression adjustment and covariate matching. We might type
. teffects ra      (wage x1 x3) (trained)
. teffects nnmatch (wage x1 x3) (trained)
When we know both, we can use the doubly robust estimators—augmented IPW and IPW with regression adjustment. We might type
. teffects aipw  (wage x1 x3) (trained x1 x2)
. teffects ipwra (wage x1 x3) (trained x1 x2)
Surprisingly, we only need to be right about one of the specifications—wage needs to be a function of x1 and x3, or trained needs to be a function of x1 and x2. This is a feature of the doubly robust methods.
To obtain the doubly robust IPW regression-adjusted results, we type
. teffects ipwra (wage x1 x3) (trained x1 x2)

Iteration 0:   EE criterion =  2.523e-16
Iteration 1:   EE criterion =  3.861e-30

Treatment-effects estimation                    Number of obs      =      1000
Estimator      : IPW regression adjustment
Outcome model  : linear
Treatment model: logit
| Robust | ||
| wage | Coef. Std. Err. z P>|z| [95% Conf. Interval] | |
| ATE | ||
| trained | ||
| (1 vs 0) | .4646677 .080218 5.79 0.000 .3074432 .6218921 | |
| POmean | ||
| trained | ||
| 0 | 8.275523 .0628417 131.69 0.000 8.152356 8.398691 | |
The output reveals that the average treatment effect (ATE)—the effect we would have observed had the entire population been treated—is 0.46, meaning 46 cents more in the wage. The output also shows that the baseline wage, the average wage in the population had no one been treated, is estimated to be $8.28.
We might instead want to know the causal effect among those who get the treatment, known as the average treatment effect on the treated or ATET. We can estimate the ATET by adding the atet option,
. teffects ipwra (wage x1 x3) (trained x1 x2), atet

Iteration 0:   EE criterion =  2.523e-16
Iteration 1:   EE criterion =  3.393e-30

Treatment-effects estimation                    Number of obs      =      1000
Estimator      : IPW regression adjustment
Outcome model  : linear
Treatment model: logit
| Robust | ||
| wage | Coef. Std. Err. z P>|z| [95% Conf. Interval] | |
| ATET | ||
| trained | ||
| (1 vs 0) | .8212578 .0948967 8.65 0.000 .6352636 1.007252 | |
| POmean | ||
| trained | ||
| 0 | 7.974128 .0886919 89.91 0.000 7.800295 8.14796 | |
The ATET is 82 cents per hour over the baseline wage of $7.97, which is the average wage that would be observed if those who got the treatment had not gotten it.
We have only scratched the surface of what teffects can do.

See the all-new 158-page Treatment-Effects Reference Manual, especially the introduction.
See New in Stata 19 to learn about what was added in Stata 19.