Inside this issue
- In the spotlight: Treatment effects
- In the spotlight: irt
- NetCourses®
- New from Stata Press
- New from the Bookstore
- 2015 International SUG meetings
- Stata Conference Chicago 2016
- Public training schedule
- Have you upgraded yet?
In the spotlight: Treatment effects

A delicate balancing act
How do you make observational data behave like experimental data?
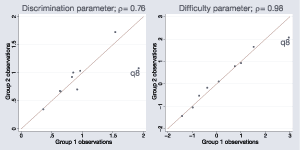
In the spotlight: irt

Discovering the relationship between test questions and unobserved abilities has never been so easy.
NetCourses®
Learn Stata from wherever you are.
Introducing our newest NetCourse, Introduction to Statistical Graphics Using Stata. Learn how to communicate your data with Stata's powerful graphics features.
Learn more and view the entire NetCourse schedule »
New from Stata Press

Stata for the Behavioral Sciences
Michael N. Mitchell
Copyright: 2015
$62.00

Thirty Years with Stata: A Retrospective
Edited by Enrique Pinzon
Copyright: 2015
$25.00
New from the Bookstore

Econometric Evaluation of Socio-Economic Programs:
Theory and Applications
Giovanni Cerulli
Publisher: Springer
Copyright: 2015
$97.50

A Stata Companion to Political Analysis, Third Edition
Philip H. Pollock III
Publisher: CQ Press
Copyright: 2015
$52.50
2015 International Stata Users Group meetings

Join us and connect with Stata users from all around the world.
|
|
|
Public training schedule
Using Stata Effectively: Data Management, Analysis, and Graphics Fundamentals
September 22–23, 2015
October 13–14, 2015
Learn techniques for efficient day-to-day use of Stata.
Survey Data Analysis Using Stata
October 15–16, 2015
Learn how incredibly easy survey data analysis is in Stata. Specifying sampling designs. Estimation. Interpretation.
Multilevel/Mixed Models Using Stata
October 19–20, 2015
Call them multilevel models, mixed-effects models, or hierarchical models. Whatever the name, learn to fit both linear and nonlinear models that measure and account for clustering or grouping at multiple levels.

Have you upgraded yet?
Take advantage of the new features in Stata 14, including Bayesian analysis, IRT, Unicode, integration with Excel®, multilevel survival models, more in treatment effects, and so much more.


