NetCourses®
New: Introduction to Statistical Graphics Using Stata

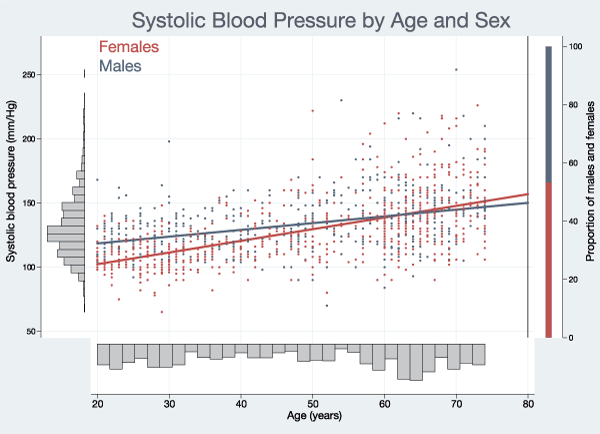
Learn how to communicate your data with Stata’s powerful graphics features. This course will introduce different kinds of graphs and demonstrate how to use them for exploratory data analysis. Topics include how to use graphs to check model assumptions, how to format, save, and export your graphs for publication using the Graph Editor, how to create custom graph schemes, how to create complex graphs by layering and combining multiple graphs, how to use margins and marginsplot, and more. The course also contains 94 videos with detailed, step-by-step explanations of the different graphs discussed in the course. Bonus material includes information on community-contributed graph commands and useful data management tools.
September 11–October 23, 2015
$150.00
Don’t forget our other NetCourses!
Introduction to Stata
Learn how to use all of Stata’s tools and become a sophisticated Stata user. You will understand the Stata environment, how to import and export data from different formats, how Stata’s intuitive syntax works, data management in Stata, and more.
September 11–October 23, 2015
$95.00
Introduction to Stata Programming
Become an expert in organizing your work in Stata. Make the most of Stata’s scripting language to improve your workflow and create concretely reproducible analyses. Learn how to speed up your work and do more complete analyses.
September 11–October 23, 2015
$150.00
Advanced Stata Programming
Learn how to create and debug your own commands that are indistinguishable from the commands that ship with Stata.
September 18–November 6, 2015
$175.00
Introduction to Univariate Time Series with Stata
Learn univariate time-series analysis with an emphasis on the practical aspects most needed by practitioners and applied researchers.
September 18–November 6, 2015
$295.00
Introduction to Panel Data Using Stata
Become an expert in the analysis and implementation of linear, nonlinear, and dynamic panel-data estimators using Stata. Geared for researchers and practitioners in all fields, this course focuses on the interpretation of panel-data estimates and the assumptions underlying the models that give rise to them.
September 25–November 6, 2015
$295.00
Introduction to Survival Analysis Using Stata
Learn how to effectively analyze survival data using Stata. We cover censoring, truncation, hazard rates, and survival functions. Discover how to set the survival-time characteristics of your dataset just once and apply any of Stata’s many estimators and statistics to those data.
September 18–November 6, 2015
$295.00
Learn more and enroll
The dates above don’t work for you? No problem! NetCourseNow allows you to set the time and work at your own pace as well. It also gives you a personal NetCourse instructor to guide you through the course.


