Three methods for survival analysis
Multiple values of parameters
Stata's power performs various power and sample-size analysis. Among these, there are three methods for survival analysis.
You can compute power, sample size, and effect size. Enter any two and get the third. You can specify single values or, to compare multiple scenarios, ranges of values of study parameters. You can obtain results either in tabular form or as a graph.
Also, do not forget facilities to easily add your own new methods to power.
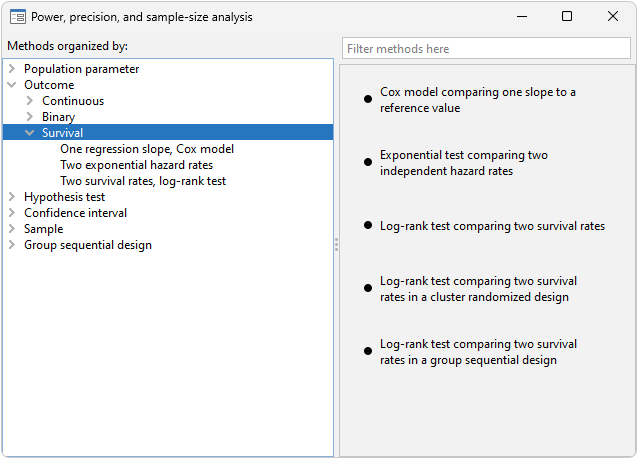
Stata's power provides three methods for survival analysis. To see the methods (and for point-and-click analysis), go to the menu Statistics > Power, precision, and sample size and under "Outcome", select "Survival".
power cox estimates required sample size, power, and effect size for survival analysis using Cox PH models with possibly multiple covariates. It provides options to account for possible correlation between the covariate of interest and other predictors and for withdrawal of subjects from the study.
power exponential estimates required sample size and power for survival analysis comparing two exponential survivor functions using the exponential test (in particular, the Wald test of the difference between hazards or, optionally, of the difference between log hazards). It accommodates unequal allocation between the two groups, flexible accrual of subjects into the study (uniform and truncated exponential), and group-specific losses to follow-up.
power logrank estimates required sample size, power, and effect size for survival analysis comparing survivor functions in two groups using the log-rank test. It provides options to account for unequal allocation of subjects between the two groups, possible withdrawal of subjects from the study (loss to follow-up), and uniform accrual of subjects into the study.
Suppose we wish to compare the one-year survival rates of patients treated with a drug or placebo. We plan to use a one-sided log-rank test with 5% significance level. Previous studies suggest that the survival probability at the end of a study is 0.5 in the reference group, and we expect this probability to vary between 0.6 and 0.7 in the treatment group. To explore the required sample sizes for a range of powers, we type:
. power logrank 0.5 (0.6 0.65 0.7), power(0.75(0.05)0.95) onesided graph
;)
As expected, as power increases, sample size increases, and detecting smaller differences between the two groups requires a substantially larger sample.
Learn much more about these methods in the Power, Precision, and Sample-Size Reference Manual. You will find many more worked examples, extended discussion, methods and formulas, references, and more.
View all of Stata's power, precision, and sample-size features.


