

In the spotlight: Enhancements to survival analysis suite
I am excited to tell you about several new features we have added to the survival analysis suite st in the 5 November 2020 update.
- sts list now reports the number at risk at specific time points with the new risktable(numlist) option.
- The adjustfor(varlist) option of sts graph, sts list, and sts generate now supports factor variables.
- The adjustfor() option also now provides convenient and flexible specifications of covariate values.
- You can now plot the failure function with stcurve using the new option failure.
Type help whatsnew in Stata to read about other st updates.
Below, I demonstrate some of the new st features.
Number at risk with sts list
Plot, list, and generate survivor and other functions at specific values of covariates
Flexible specification of covariate values with stcurve
You have always wanted to see the number at risk with sts list when listing the survivor or another function at specific time points. Now you can! Use the new risktable(numlist) option. Here we request results to be reported from times 5 to 35 in increments of 5, and the number at risk is now displayed in the second column.
. webuse cancer
(Patient Survival in Drug Trial)

. sts list, risktable(5(5)35)

         failure _d:  died
   analysis time _t:  studytime
| At Survivor Std. |
| Time Risk Fail Lost Function Error [95% Conf. Int.] |
| 5 42 8 3 0.8333 0.0538 0.6943 0.9129 |
| 10 31 6 2 0.6833 0.0678 0.5302 0.7957 |
| 15 23 3 4 0.5383 0.0749 0.3821 0.6712 |
| 20 16 5 1 0.4870 0.0761 0.3326 0.6249 |
| 25 10 2 2 0.2922 0.0767 0.1543 0.4449 |
| 30 6 1 3 0.2557 0.0753 0.1247 0.4093 |
| 35 2 0 2 0.1918 0.0791 0.0676 0.3634 |
You can also use the new tmin(#) and tmax(#) options to restrict the range of the displayed analysis times. In this case, instead of showing results for all observed times, we show only those from time 20 to time 30:
. sts list, tmin(20) tmax(30)

         failure _d:  died
   analysis time _t:  studytime
| At Survivor Std. |
| Time Risk Fail Lost Function Error [95% Conf. Int.] |
| 20 16 0 1 0.4870 0.0761 0.3326 0.6249 |
| 22 15 2 0 0.4221 0.0786 0.2680 0.5684 |
| 23 13 2 0 0.3572 0.0788 0.2087 0.5083 |
| 24 11 1 0 0.3247 0.0780 0.1809 0.4771 |
| 25 10 1 1 0.2922 0.0767 0.1543 0.4449 |
| 28 8 1 1 0.2557 0.0753 0.1247 0.4093 |
Plot, list, and generate survivor and other functions at specific values of covariates
Many of you are familiar with the adjustfor(varlist) option of sts graph, sts list, and sts generate to adjust the survivor (or another) function for covariates by fitting a Cox regression model.
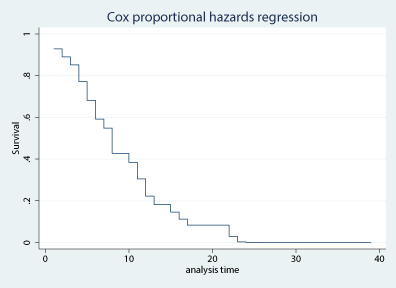
The function produced by default is a baseline function, which corresponds to zero values of the specified covariates. Previously, to adjust for other covariate values, you had to manually recenter the covariates around the desired values prior to using one of the above sts commands. Now you can simply specify the new at() option within the adjustfor() option. Here we graph the survivor function adjusting for age=50 and drug=1.
. webuse cancer
. sts graph, survival adjustfor(age i.drug, at(age=50 drug=1))
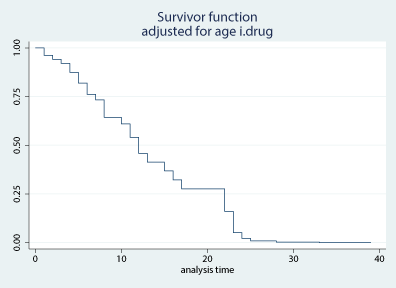
Notice that I included a factor variable, i.drug, in adjustfor(). The support of factor variables in this option is also new.
If we want to obtain the survivor function at the mean values of the covariates, we can simply type
. sts graph, survival adjustfor(age i.drug, atmeans)
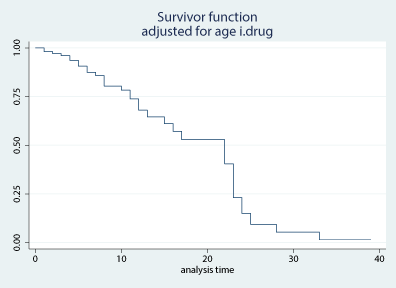
When combined with by(groupvar) or strata(groupvar), the atmeans option corresponds to using the group-specific means for age and for factor indicators of drug. To use the overall means instead, we can replace atmeans with atomeans.
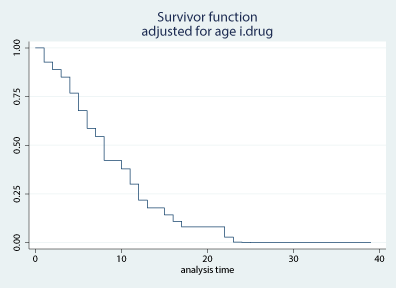
If we want to use the base level for drug instead of the means of indicators, we can specify atbase:
. sts graph, survival adjustfor(age i.drug, atmeans atbase)

We can even produce the survivor function evaluated at the median value for age instead of the mean:
. sts graph, survival adjustfor(age i.drug, at((median) age) atbase)
See Syntax of at() in [ST] adjustfor_option for other usages of the at() option.
I showed sts graph, but you can use the above specifications of adjustfor() with sts list and sts generate; see [ST] adjustfor_option for details.
By the way, the adjustfor(varlist) option is also supported by stphplot, although the default there is to use the mean values of the covariates instead of zeros. (The new adjustfor() option replaces the old adjust() option.)
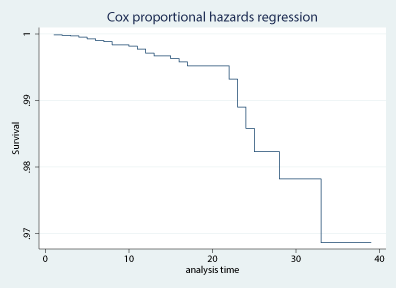
Flexible specification of covariate values with stcurve
stcurve plots the survivor or another function after various survival regression models such as streg and stcox.
. webuse cancer
. stcox age i.drug
. stcurve, survival
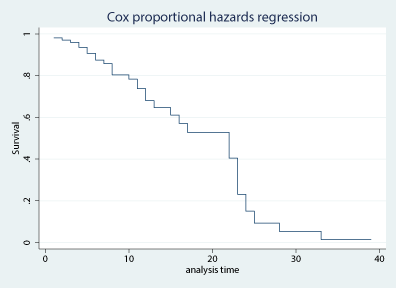
By default, the function is evaluated at the mean covariate values. For factor variables (i.drug), the means of factor indicators are used by default. If you would like to use the base levels instead, you can now specify this more easily by typing
. stcurve, survival at((base) drug)
Or, more generally, for all factor variables in your model:
. stcurve, survival at((base) _factor)
If you would like to evaluate the function at zero values of all continuous covariates and baseline factors for factor variables, you could type
. stcurve, survival at((zero) _all)
The above specification is a shortcut for
. stcurve, survival at((zero) _continuous (base) _factor)
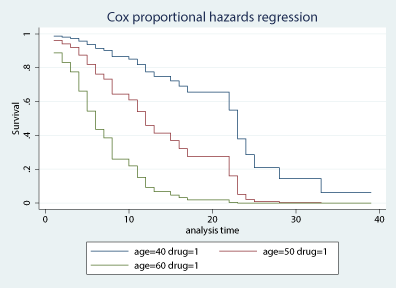
To specify multiple values for the same covariate, you previously had to specify multiple at#() options. Now you can specify multiple covariate values more conveniently within the same at() option:
. stcurve, survival at(age=(40 50 60) drug=1)
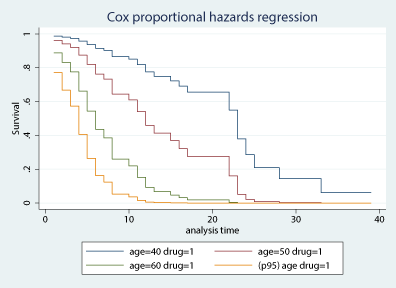
Repeat the at() option to also include functions evaluated at various covariate summaries such as medians, percentiles, minimums, maximums, and more. For instance, we can add the survivor function evaluated at the 95th percentile of age to the above graph:
. stcurve, survival at(age=(40 50 60) drug=1) at((p95) age drug=1)
See Using at() with stcurve in [ST] stcurve for more examples.
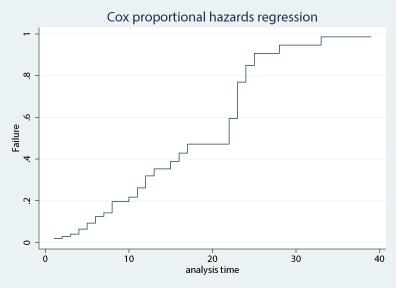
And you can now plot the failure function with stcurve by specifying the new failure option:
. stcurve, failure
To access all of these features, simply type
. update all
in Stata 16.
I hope you find these new features useful!
— Yulia Marchenko
Vice President, Statistics and Data Science


