Stata's power performs various power and sample-size analysis. Among these, there are three methods for ANOVA.
You can compute power, sample size, and effect size. Enter any two and get the third. You can specify single values or, to compare multiple scenarios, ranges of values of study parameters. You can obtain results either in tabular form or as a graph.
Also, do not forget facilities to easily add your own new methods to power.
Stata's power provides three methods for ANOVA. To see the methods (and for point-and-click analysis), go to the menu Statistics -> Power, precision, and sample size and under Hypothesis test, select ANOVA.
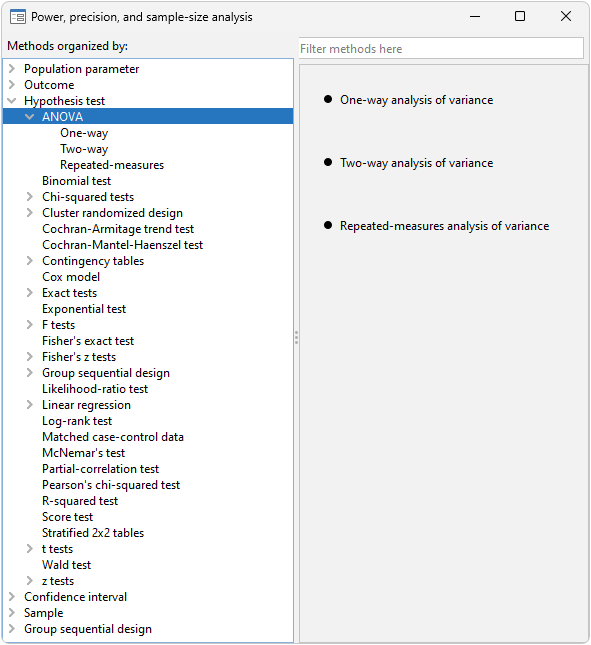
power oneway estimates required sample size, power, and effect size for a one-way ANOVA model. You can choose between the overall F test of the equality of group means and a test of a mean contrast. You can either specify group means or specify their variability in the computations.
power twoway estimates required sample size and power for a two-way fixed-effects ANOVA model. You can choose the overall F test of the main effect of a row factor, a column factor, or a row-by-column interaction. You can either specify cell means or specify the variance explained by the tested effect.
power repeated estimates required sample size, power, and effect size for one-way and two-way fixed-effects repeated-measures ANOVA models. You can choose the overall F test of the main effect of a between-subjects factor, a within-subject factor, or a between-within factor interaction. You can either specify cell means or specify the variance explained by the tested effect.
Suppose that we want to compare the effects of three drugs on blood pressure by using a one-way ANOVA. From pilot studies, the variance between group means was estimated to be 2.3. We explore the estimated power for a range of sample sizes and error variances.
. power oneway, ngroups(3) n(150(20)500) varmeans(2.3) varerror(35 40 50 60) graph
;)
For a given value of the error variance, the power increases with sample size. Also, the power is higher for smaller values of the error variance.
Learn much more about these methods in Power, Precision, and Sample-Size Reference Manual. You will find many more worked examples, extended discussion, methods and formulas, references, and more.
Watch Sample size calculation for one-way analysis of variance using Stata.
View all of Stata's power, precision, and sample-size features.


