1 item has been added to your cart.
| Title | Create and export a table of regression results from Stata to other formats | |
| Author |
Gabriela Ortiz, StataCorp Pei-Chun Lai, StataCorp |
After fitting a regression model, or several models, you may want to export a table of results from Stata to another format. This FAQ will show you how to easily create a table of regression results and export it to other files, including Word, Excel, and PDF. This FAQ is organized as follows:
The etable command is designed to build and export a table of regression results in a single step. In the following example, we will use etable to create a table with results from three linear regression models and export the table to a .docx file.
. clear all

. webuse nhanes2l
(Second National Health and Nutrition Examination Survey)

. quietly regress bpsystol age weight i.region

. estimates store model1

. quietly regress bpsystol i.sex weight i.agegrp

. estimates store model2

. quietly regress bpsystol age weight i.agegrp

. estimates store model3

. etable, estimates(model1 model2 model3) showstars showstarsnote title("Table 1. Models for
     systolic blood pressure") export(mydoc.docx, replace)
In this example, we use estimates store to store the results from each model. Then, we use etable to create a table with all three sets of results by listing the names of the stored results in the estimates() option. We also specify the showstars and showstarsnote options to add stars for statistically significant results and a note explaining what the stars represent. Here is the resulting .docx file:
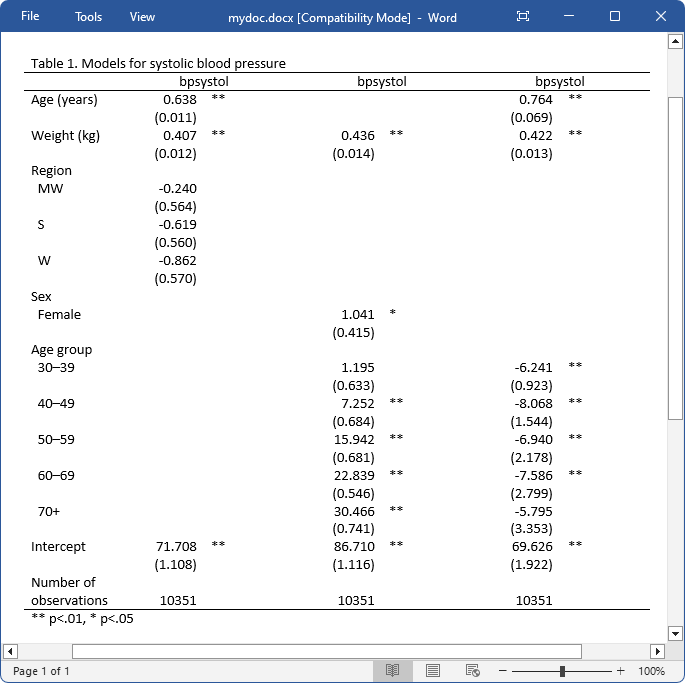
Note that the export() option allows you to export your table to several formats. For example, if you instead want to export this table in a different format, such as a Microsoft Excel or a PDF file, you would change the filename to mydoc.xlsx or mydoc.pdf, respectively. For a comprehensive list of supported file formats, please type help etable in the Command window.
The etable command also allows you to format coefficients and model statistics, modify labels, and add notes. For more examples of using etable, please view this spotlight article.
The etable command simultaneously creates a table and stores the results in a collection, which means you can customize your table of estimation results further with the collect suite of commands. For example, you can rearrange the layout of the table, modify the borders, and much more; to learn more, type help tables_intro in the Command window.
After fitting a regression model, we can easily export the table of results to an .xlsx, a .docx, or a .pdf file by using the putexcel, putdocx, or putpdf command, respectively. The put* commands also allow you to export images, text, and other types of tables to .xlsx, .docx, and .pdf. Below, we demonstrate how to export a table of estimation results to each format.
We begin by exporting a couple of tables to an Excel file. This example assumes you have issued the code from the previous example; if you have not done so, please run the code before issuing the following commands.
putexcel set mytable, replace
putexcel A1 = collect
regress bmi age weight
putexcel I1="Table 2: Model for BMI"
putexcel I2 = etable
putexcel N2:O2, merge
putexcel save
After setting the workbook for export, we issued putexcel A1 = collect. This command adds a table from the current collection to our Excel workbook. Recall that the etable command we used in our previous example simultaneously created a table and stored the results in a collection. With this putexcel command, we have added the table from that collection to our new file, mytable.xlsx. Then, we fit a new model for body mass index (BMI). The putexcel I2 = etable command creates a coefficient table from the model we fit with regress and places it in the Excel file beginning with the upper-left cell I2. Note the distinction; in this command “etable” is simply an argument for the putexcel command, whereas in our previous example we used the etable command.
Here is the resulting file:
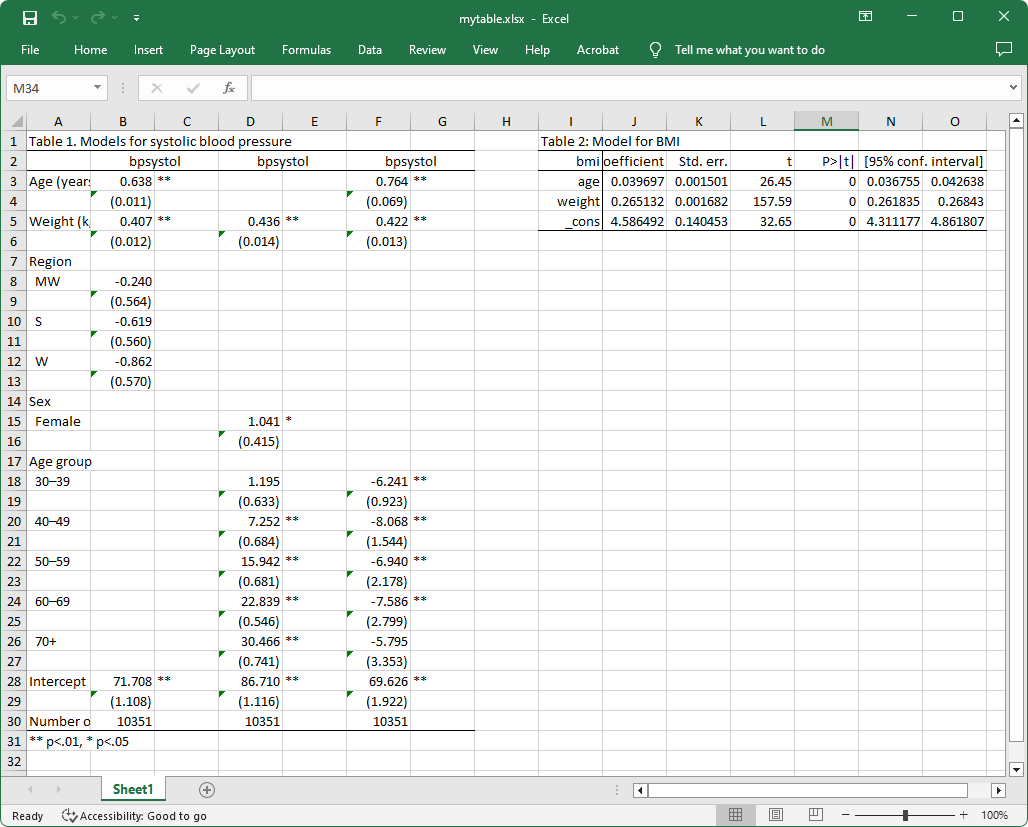
Note how the first table contains results from the three models we previously fit, and it looks just like the layout we obtained with the etable command in our first example. On the other hand, the table on the right side of the Excel sheet is a coefficient table that was generated with putexcel I2 = etable; here we see t statistics, p-values, and confidence intervals. The putexcel N2:O2, merge command was used to merge the cells N2 and O2, so that the CI label could be spread out across both cells.
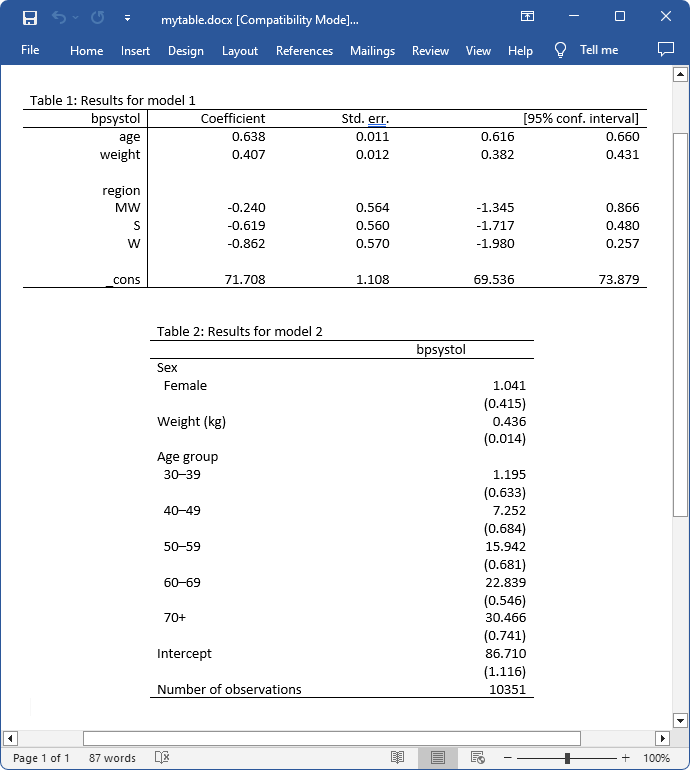
Next, we demonstrate how to export tables to Word-compatible files with putdocx. First, we create an active document with putdocx begin. After fitting our model, we create and export a table called T1 using the etable output type. The etable syntax will automatically include all results from the coefficient table, but we excluded the p-values and t statistics with the regress option nopvalues. Then, we fit our second model and run the etable command, which by default will create a table with only coefficients and standard errors. We then use collect style putdocx to specify the style for exporting to .docx files; we modified the width to 60% of the default and specify that our table be centered horizontally. Finally, we use putdocx collect to export the table from the collection created by the etable command.
clear all
webuse nhanes2l
putdocx begin
regress bpsystol age weight i.region, cformat(%6.3f) nopvalues
putdocx table T1 = etable, title("Table 1: Results for model 1")
regress bpsystol i.sex weight i.agegrp
etable, title("Table 2: Results for model 2")
collect style putdocx, width(60%) halign(center)
putdocx collect
putdocx save mytable, replace
Here is the resulting file, mytable.docx:
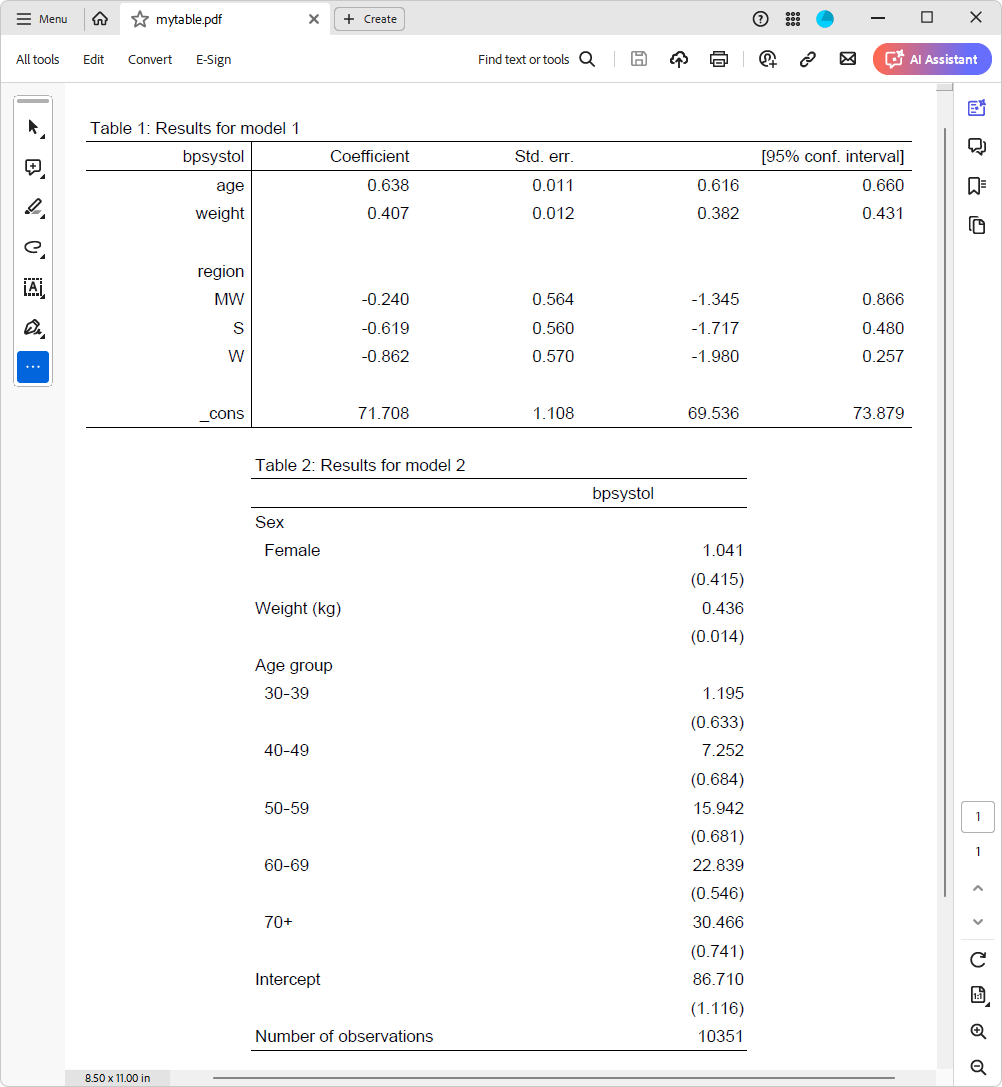
Next, we demonstrate how to export tables to a PDF file with putpdf; the syntax is very similar to putdocx.
First, we create an active document with putpdf begin. After fitting our model, we create and export a table called T1 using the etable output type. The etable syntax will automatically include all results from the coefficient table, but we excluded the p-values and t statistics. Then, we fit our second model and run the etable command, which by default will create a table with only coefficients and standard errors. We then use collect style putpdf to specify the style for exporting to .pdf files; we modified the width to 60% of the default and specify that our table be centered horizontally. Finally, we use putpdf collect to export the table from the collection created by the etable command and putpdf save to save our work under the filename mytable.pdf.
clear all
webuse nhanes2l
putpdf begin
regress bpsystol age weight i.region, cformat(%6.3f) nopvalues
putpdf table T1 = etable, title("Table 1: Results for model 1")
regress bpsystol i.sex weight i.agegrp
etable, title("Table 2: Results for model 2")
collect style putpdf, width(60%) halign(center)
putpdf collect
putpdf save mytable, replace
Here is the resulting file: