
1 item has been added to your cart.
| Title | What methods can we use to export a customizable table from Stata to another format? | |
| Author | Natasha Gimpelson, StataCorp |
In Stata, we can create customizable tables using the collect/table/etable/dtable commands, and those tables can be exported to files of different formats.
There are three possible ways to export such tables:
By the way, FAQ: What file formats are supported when exporting tables from Stata? ( .docx, .xlsx, .pdf, .html, .md, .tex, .txt, and .smcl) lists all the file formats that Stata can export tables to.
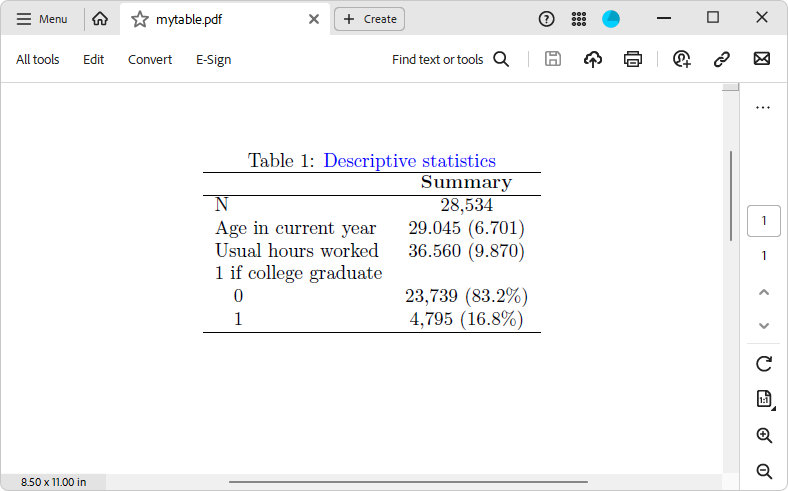
Here is an example using dtable to create and export a descriptive table as a LaTeX file, with the export() option. Notice that we specify some options to adjust the font color, bold a column header, and adjust the alignment of the cells. Some of the style changes (for example, color) will not be reflected in the Stata Results window (FAQ: Why can't I observe the style changes (background shading, font, etc.) in my table in the Results window? explains why). However, they will be visible in the exported file.
. webuse nlswork.dta, clear
(National Longitudinal Survey of Young Women, 14-24 years old in 1968)

. dtable age hours i.collgrad, title(Descriptive statistics) titlestyles(font(, color(blue)))
     column(summary( ,font(, bold))) halign(center) export(mytable.tex, replace)
Here is the compiled PDF file using the generated .tex file:
Note that for LaTeX and HTML files you can specify the suboption tableonly within the export() option, which will export just the table rather than creating a complete document, allowing you to insert the table into a more extensive document. For example:
. dtable age hours, export(mytable.tex, tableonly replace)
You can export the table to different formats by specifying the appropriate file extension within the option export() (for example, .pdf for PDF documents and .docx for Word documents).
If your tables are generated with table/collect layout, or if you need to further customize the look of the table generated with etable/dtable using the collect commands, you can export your tables using the command collect export. Please note that this approach exports any existing table or tables from a collection to a specified document, regardless of how it was initially generated.
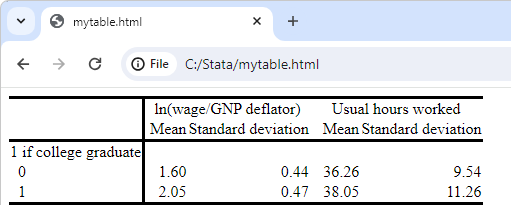
Below, we use the table command to create the table, customize the style and layout, and finally export it with collect export.
. webuse nlswork.dta, clear
(National Longitudinal Survey of Young Women, 14-24 years old in 1968)

. table (collgrad), statistic(mean hours ln_wage) statistic(sd hours ln_wage)

. collect style cell result[mean sd], nformat(%8.2f)

. collect layout (collgrad[0 1]) (var[ln_wage hours]#result)

. collect export mytable.html, replace
The exported HTML file looks like this:
For more detailed information about this method, please see [TABLES] collect export.
These commands offer the most flexibility in embedding Stata results into Word, PDF, and Excel documents. In addition to exporting tables with Stata results, you can also include formatted text and Stata graphs in the final document.
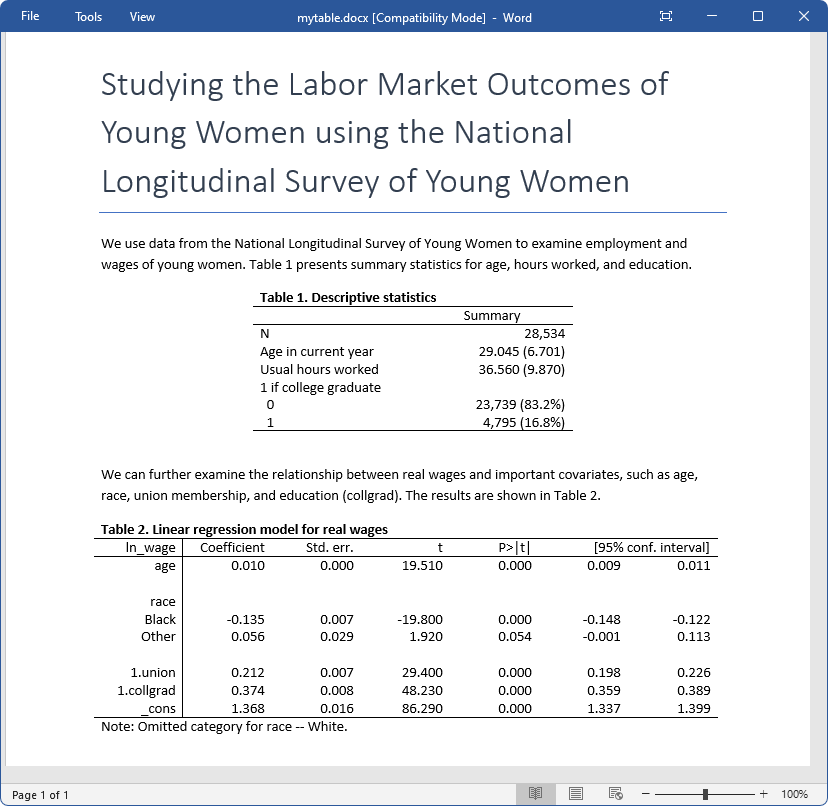
Here is an example using putdocx, which creates a Word document and adds paragraphs and tables:
. webuse nlswork.dta, clear
(National Longitudinal Survey of Young Women, 14-24 years old in 1968)

. putdocx begin

. putdocx paragraph, style(Title)

. putdocx text ("Studying the Labor Market Outcomes of Young Women using the National Longitudinal Survey
     of Young Women")

. putdocx textblock begin

We use data from the National Longitudinal Survey of Young Women to examine employment and wages of young women.
Table 1 presents summary statistics for age, hours worked, and education.

. putdocx textblock end

. dtable age hours i.collgrad, title(Table 1. Descriptive statistics) titlestyles(font(, bold))

. collect style putdocx, width(50%) halign(center)

. putdocx collect

. putdocx textblock begin

We can further examine the relationship between real wages and important covariates, such as age, race, union
membership, and education (collgrad). The results are shown in Table 2.

. putdocx textblock end

. regress ln_wage age i.race i.union i.collgrad

. putdocx table reg = etable, title(Table 2. Linear regression model for real wages) note("Note: Omitted
     category for race -- White.")

. putdocx table reg(.,2/7), nformat(%9.3f)

. putdocx table reg(1,.), bold

. putdocx save mytable.docx, replace
The file created by running the above code looks like:
The syntax for putpdf is the same, except that we need to change the extension of the created file (for example, mytable.pdf). More information can be found in [RPT] putdocx collect and [RPT] putpdf collect.
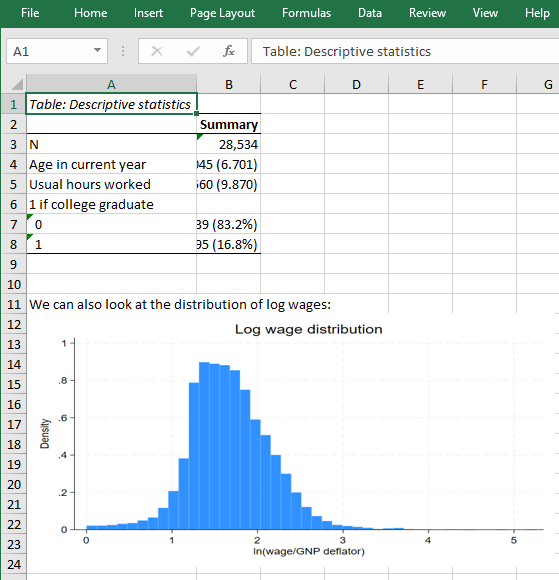
On the other hand, the syntax for putexcel is different. We start by setting the Excel file name and path using putexcel set, followed by writing any results to the file and exporting the table. Please note that we need to specify the cells we want to export the table and other objects to. In the end, we call putexcel save to close and save the file.
You can learn more about this command in [RPT] putexcel.
. webuse nlswork.dta, clear
(National Longitudinal Survey of Young Women, 14-24 years old in 1968)

. putexcel set mytable.xlsx, replace sheet(results, replace)

. dtable age hours i.collgrad, column(summary( ,font(, bold)))

. putexcel A1 = "Table: Descriptive statistics", italic

. putexcel A2 = collect

. histogram ln_wage, title("Log wage distribution")

. graph export hist_wage.png, replace

. putexcel A11 = "We can also look at the distribution of log wages:"

. putexcel A12 = image(hist_wage.png)

. putexcel save
The resulting file appears as
For more advanced material on how to export multiple tables, you can refer to FAQ: How can I export multiple tables to one file?
For the comprehensive overview of how to customize tables prior to exporting, please refer to the Stata Customizable Tables and Collected Results Reference Manual.


