
1 item has been added to your cart.
| Title | How can I export multiple tables to one file? | |
| Author | Gabriela Ortiz, StataCorp |
When creating a table with dtable, etable, or table, we can easily export the table with their shared export() option. Additionally, any table from a collection can be exported with collect export, regardless if it was created using table, dtable, etable, collect get, or the collect prefix. table, dtable, etable, and collect export also allow you to export multiple tables to a single Excel, LaTeX, SMCL, HTML, or plain text file.
Below, you’ll learn three methods for exporting multiple tables to a single file: (1) using the export() option shared by dtable and etable, (2) using the putdocx, putpdf, and putexcel commands, and (3) using the dyndoc command. Which method you use will depend on the file format you want to export to. In short, the first method allows you to export multiple tables to plain text, Markdown, SMCL, Excel, LaTeX, and HTML. The second method is designed for exporting to Word-compatible files, PDF, and Excel files. Finally, the third method is designed for exporting to HTML files. The second and third methods also allow you to export graphs and text, in addition to however many tables you like.
In general, it is easy to export multiple tables to a single file by using the export() option shared by table, dtable, and etable. However, for certain file types, such as LaTeX and HTML files, an additional step is required. In this section we demonstrate how to use the export() option and some things you need to keep in mind when exporting to certain file types.
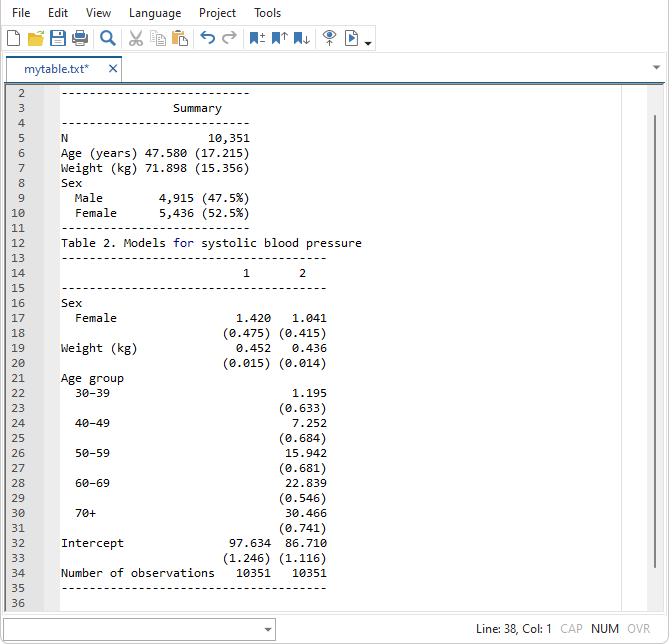
Here is a quick example for exporting multiple tables to the same plain text file.
First, we create a table of descriptive statistics and use the export() option to export it to the file mytable.txt. If you prefer a Markdown or SMCL file, simply change the filename to mytable.md or mytable.smcl. Next, we fit two regression models and we create an estimation table with etable; we specify the suboption append to append this table to the existing file mytable.txt. If we wanted to add any other tables with table, dtable, or etable, we would need to specify the append suboption with those commands as well.
. webuse nhanes2l, clear
(Second National Health and Nutrition Examination Survey)

. dtable age weight i.sex, title(Table 1. Descriptive statistics) export(mytable.txt)

. quietly: regress bpsystol i.sex weight

. estimates store model1

. quietly: regress bpsystol i.sex weight i.agegrp

. estimates store model2

. etable, estimates(model1 model2) column(index) title(Table 2. Models for systolic blood pressure)
     export(mytable.txt, append)
Now we have our two tables in a single file:
If you would like to export multiple tables to a LaTeX or HTML file, an additional step is required because the document gets closed after we export our first table.
For example, when we export our first table to LaTeX, a complete document is created. Once we append any other tables, those tables are added after the document is closed. For these additional tables, the tableonly option is implied, meaning only the table is exported, rather than a complete document being created. So, if we run the following code to export our tables to a LaTeX file
. webuse nhanes2l, clear
(Second National Health and Nutrition Examination Survey)

. dtable age weight i.sex, title(Table 1. Descriptive statistics) export(mytable.tex)

. quietly: regress bpsystol i.sex weight

. estimates store model1

. quietly: regress bpsystol i.sex weight i.agegrp

. estimates store model2

. etable, estimates(model1 model2) column(index) title(Table 2. Models for systolic blood pressure)
     export(mytable.tex, append)
our file mytable.tex would look as follows:
\documentclass{article}
...
\begin{document}
\begin{table}[!h]
...
\end{table}
\end{document}
\begin{table}[!h]
\caption{Table 2. Models for systolic blood pressure}
...
If we were to compile the file as is, the second table wouldn’t be included because it was added after the document was closed. Therefore, we simply need to move the \end{document} command to the end of the file, so that all tables can be included in the body of the document.
Similarly, when we export our first table to HTML, a complete document is created, and it includes the table in the body of the document. Once we append any other tables, those tables are added after the document is closed, and the borders of the tables are not included in the HTML file.
For example, if we ran the following
. webuse nhanes2l, clear
(Second National Health and Nutrition Examination Survey)

. dtable age weight i.sex, title(Table 1. Descriptive statistics) export(mytable.html)

. quietly: regress bpsystol i.sex weight

. estimates store model1

. quietly: regress bpsystol i.sex weight i.agegrp

. estimates store model2

. etable, estimates(model1 model2) column(index) title(Table 2. Models for systolic blood pressure)
     export(mytable.html, append)
and opened mytable.html from a web browser, we would see that the second table does not have the borders that we see in the Results window. If we viewed mytable.html from a text editor, it would look as follows, although of course it would have a lot more output.
<head>

<meta charset="utf-8" />
<meta http-equiv="Content-type"
      content="text/html; charset=utf-8" />

<style>

table {
  border-collapse: collapse;
}
...
<body>
<p class="DTable_title">
Table 1. Descriptive statistics
</p>
<table class="DTable1">
...
</table>

</body>
</html>
<p class="ETable_title">
Table 2. Models for systolic blood pressure
</p>
<table class="ETable1">
...
</table>
We can see that Table 2 is added after the document is closed (</html>). Therefore, we should instead use the tableonly option with each table we’re exporting, and then create a separate HTML file to include these tables we have created.
For example, here is our modified code which exports each table to a separate file:
. webuse nhanes2l, clear
(Second National Health and Nutrition Examination Survey)

. dtable age weight i.sex, title(Table 1. Descriptive statistics) export(mytable1.html, replace tableonly)

. quietly: regress bpsystol i.sex weight

. estimates store model1

. quietly: regress bpsystol i.sex weight i.agegrp

. estimates store model2

. etable, estimates(model1 model2) column(index) title(Table 2. Models for systolic blood pressure)
     export(mytable2.html, replace tableonly)
The files mytable1.html and mytable2.html are created, along with their CSS files, mytable1.css and mytable2.css. Cascading Style Sheets (CSS) define the style for your webpage. You can include these .css files generated by table, dtable, and etable, or apply your own, when creating your master file.
Here is our master file, myfile.html, which incorporates the two tables above:
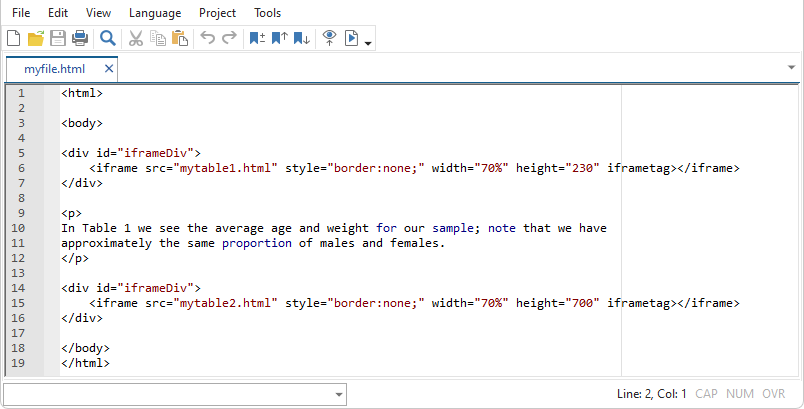
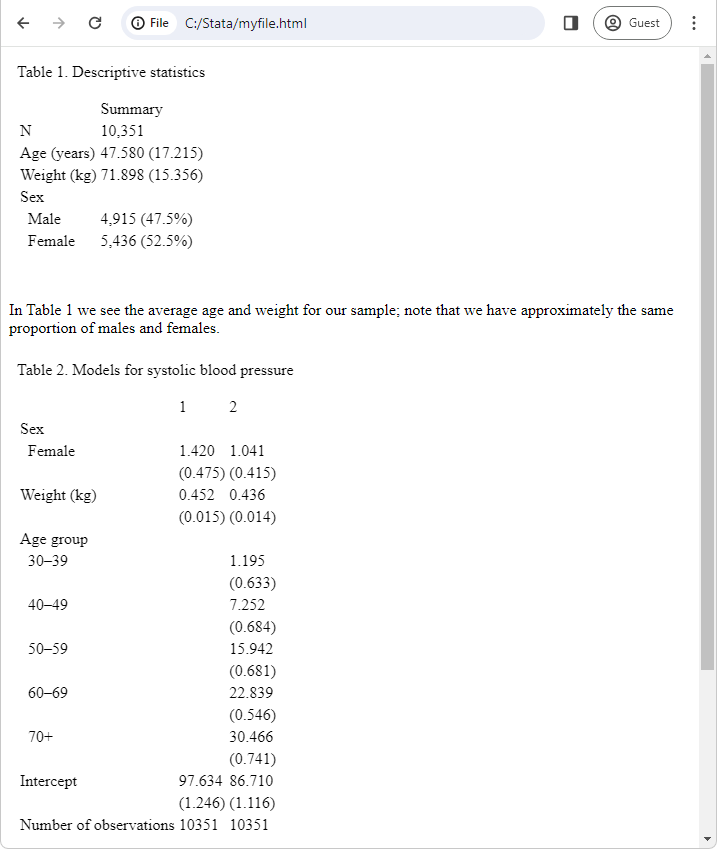
Here we used an inline frame to embed our tables (mytable1.html and mytable2.html) in our HTML file. We removed the borders that are included by default, and modified the height and width. When we view myfile.html in our web browser, we see:
An easier method for exporting multiple tables to an HTML file is to use the dyndoc command; for more information, jump down to Export multiple tables with dyndoc (.html).
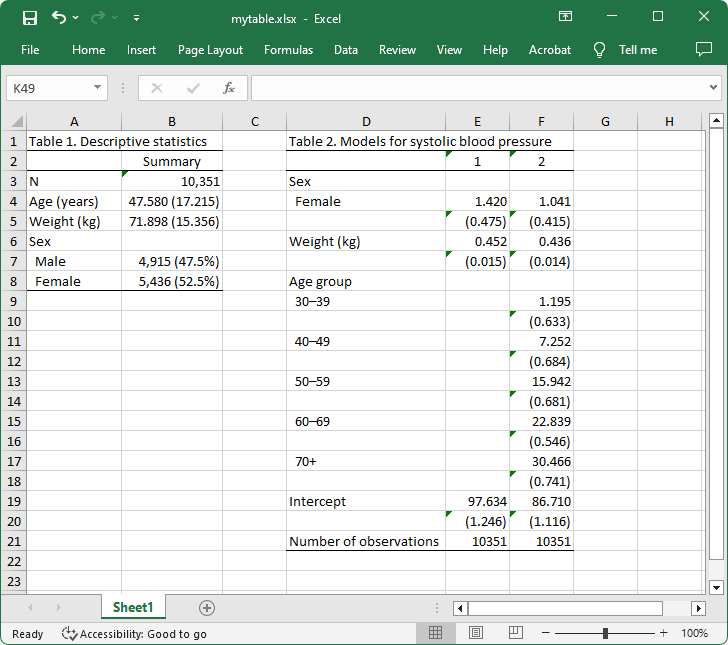
When exporting to an Excel file, you can export multiple tables to the same worksheet or to different worksheets in the same workbook; you simply have to specify the modify suboption to let Stata know that you are modifying an existing Excel file. By default, each table is placed beginning at cell A1, which means multiple tables will overlap. Therefore, to export multiple tables to the same worksheet, you should specify modify and the upper-left cell for the starting point with suboption cell(). Alternatively, you could export each table to a separate worksheet by specifying modify and a worksheet name with suboption sheet().
Below, I first export the table of descriptive statistics; this table is placed at the top left of the sheet, with cell A1 as the starting point. Then, I create the table of estimation results and place this table beginning with D1 as the upper-left cell.
. webuse nhanes2l, clear
(Second National Health and Nutrition Examination Survey)

. dtable age weight i.sex, title(Table 1. Descriptive statistics) export(mytable.xlsx)

. quietly: regress bpsystol i.sex weight

. estimates store model1

. quietly: regress bpsystol i.sex weight i.agegrp

. estimates store model2

. etable, estimates(model1 model2) column(index) title(Table 2. Models for systolic blood pressure)
     export(mytable.xlsx, cell(D1) modify)
Here is our resulting file:
If you prefer to export the second table to a separate worksheet, you would specify the sheet() suboption, as shown below:
. etable, estimates(model1 model2) column(index) title(Table 2. Models for systolic blood pressure)
     export(mytable.xlsx, sheet(Estimation) modify)
If you are creating tables with commands other than table, dtable, and etable, you would instead use collect export filename.suffix to export your first table, and collect export filename.suffix , append to export additional tables to the same file. And keep in mind that the notes above about HTML, LaTeX, and Excel still apply when using collect export. Learn more about exporting tables with collect export in the Stata Customizable Tables and Collected Results Reference Manual.
If you want to export multiple tables to a Microsoft Word-compatible file, PDF, or Excel file, you’ll use the putdocx, putpdf, and putexcel commands. These reproducible reporting commands allow you to export Stata graphs and formatted text in addition to however many tables you’d like. Although you can export multiple tables to an Excel file with the collect export, table, dtable, and etable commands, the putexcel suite offers the advantage of exporting images and text.
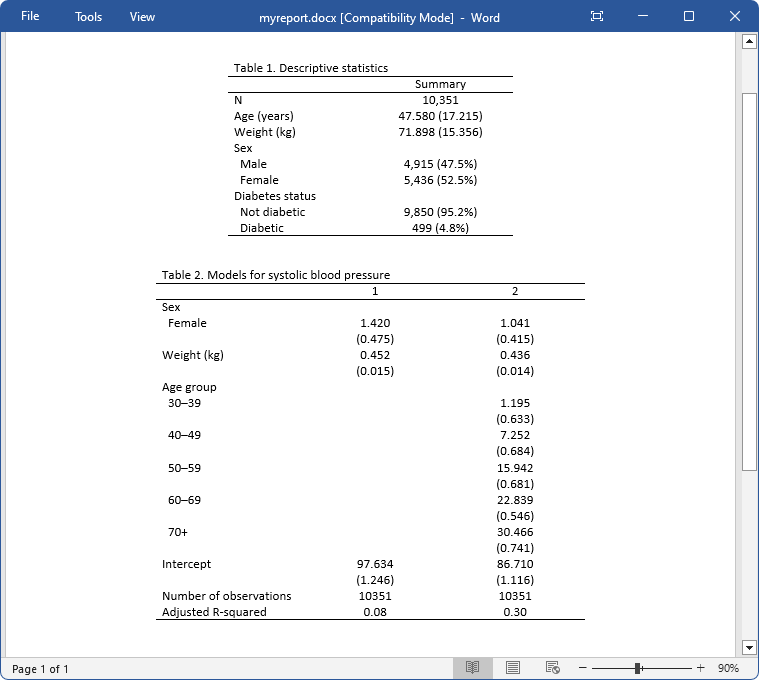
For example, we run the code below from our do-file. First, we use putdocx begin to create an active document and then we use dtable to create a table of descriptive statistics. Before exporting our table, we can use collect style putdocx to specify the table style for exporting to the Office Open XML (.docx) format, including the table width, horizontal alignment, and more. Below, we set the width of the first table to 50% of its default width, then we use putdocx collect to export the table from the current collection to the document. Then, we fit our two regression models and create our estimation table with etable. We then set the width and horizontal alignment for this table before exporting it. Once we export all our content we save our work under the filename myreport.docx.
. putdocx begin

. webuse nhanes2l, clear
(Second National Health and Nutrition Examination Survey)

. dtable age weight i.sex i.diabetes, halign(center) title(Table 1. Descriptive statistics)

. collect style putdocx, width(50%) halign(center)

. putdocx collect

. // Export Table 1

. quietly: regress bpsystol i.sex weight

. estimates store model1

. quietly: regress bpsystol i.sex weight i.agegrp

. estimates store model2

. etable, estimates(model1 model2) mstat(N) mstat(r2_a) column(index) center title(Table 2. Models for
     systolic blood pressure)

. collect style putdocx, width(75%) halign(center)

. putdocx collect

. // Export Table 2

. putdocx save myreport, replace
Here is our resulting file:
If you want to export multiple tables to a PDF file, you would use the putpdf begin, putpdf collect, and collect style putpdf commands in a similar manner. If you want to export tables, graphs, and text to an Excel file you can use the putexcel suite; see Example 7 in putexcel for an example of exporting results from a collection to an Excel file.
Learn more about exporting tables to Microsoft Word-compatible files, PDF, and Excel files in the Stata Reporting Reference Manual.
If we wish to export our tables to an HTML file we can do so by combining Markdown-formatted text and Stata code in a plain text file. We then use the dyndoc command to process the Stata code and Markdown-formatted text to create an HTML file with the Stata output. The output will look similar to what you see in the Stata Results window, with tables using the plain text format. Although, as we will see below, we can modify the style of our HTML file with a Cascading Style Sheet (CSS).
For example, we created a file named dyndoc_ex1.md with the contents below. We begin by using Stata’s dynamic tag «dd_version» to specify the minimum version required to convert the file; note that this is different from Stata’s version command. We then use Markdown-formatted text: we underline our text with equal signs to create a heading and use two pound signs to create sub-headings. Then, we use Stata’s dynamic tag «dd_do» to execute our Stata commands and include the output in our final document; the four tildes format our Stata output as plain text. Before creating our estimation table, we need to fit our two regression models and store the results. We don’t want to include the output from this block of code in our final document, so we use the quietly argument to suppress the output. Finally, we issue our etable command.
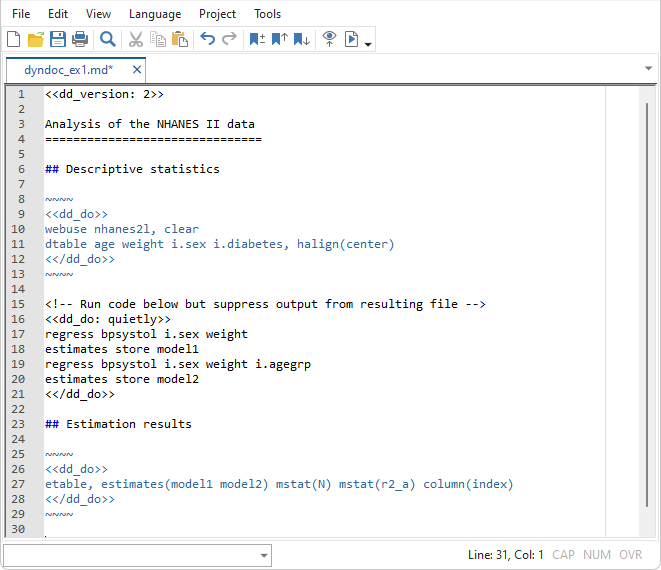
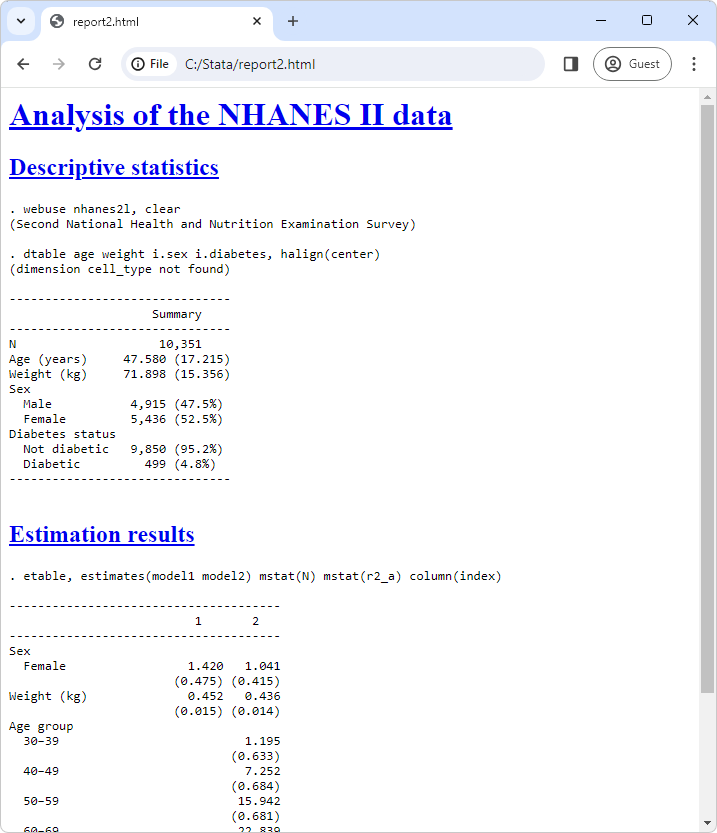
We then use dyndoc to process our dynamic tags and the Markdown-formatted text in dyndoc_ex1.md to create our HTML file:
. dyndoc dyndoc_ex1.md, saving(report2.html)
Here is our resulting file:
Instead of exporting our tables in plain text, we can export them in Markdown or HTML format; this will allow us to modify the look of our tables, and the overall look of our HTML file, with a .css file.
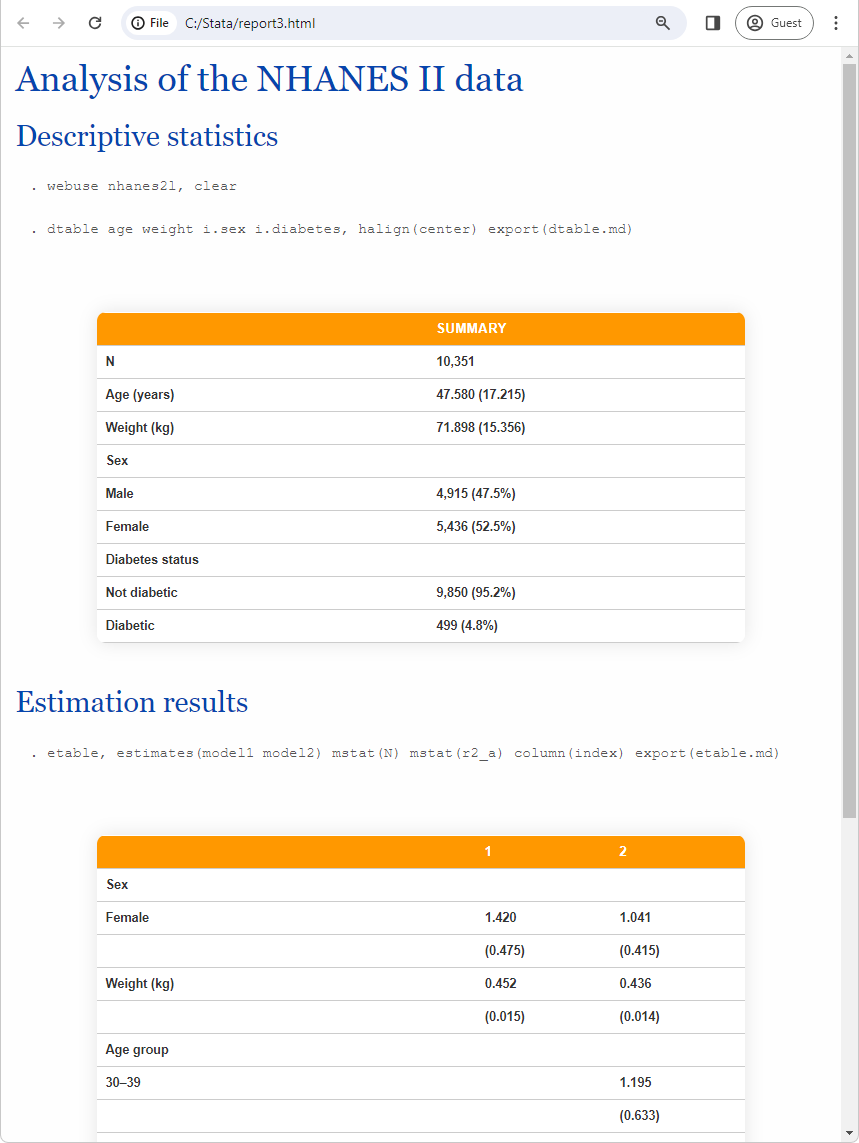
For example, building on our last Markdown file, we will now work with the file dyndoc_ex2.md. Here, we now link to a CSS file, which will determine the style for our HTML file. And, now we specify the nooutput argument with the «dd_do» dynamic tag, which means the code will be executed but the output will not be included in the HTML file. We then include the resulting tables (dtable.md and etable.md) with the «dd_include» dynamic tag. The reason we need to first export the table with the export() option and then include it with «dd_include» is so that the style from the .css file can be applied to these tables. Otherwise, the .css file generated by dtable and etable will override the specifications from our stmarkdown.css file, and ultimately determine the style for our table; in this case, we would get dashed border lines as we do in the example above.
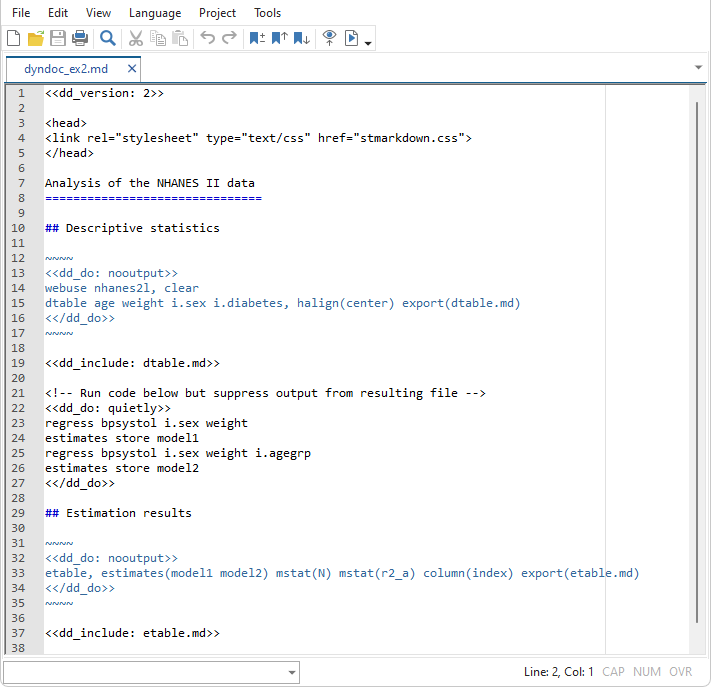
We now use dyndoc to process our dynamic tags and the Markdown-formatted text in dyndoc_ex2.md to create our HTML file:
. dyndoc dyndoc_ex2.md, saving(report3.html)
Here is our resulting file:
Learn more about exporting tables to HTML files in the Stata Reporting Reference Manual; see [RPT] dyndoc.


