1 item has been added to your cart.
Researchers perform cointegration tests when time series are nonstationary to determine whether they have a stable, long-run relationship. xtcointtest implements a variety of tests for data containing many long panels, known as the large-N large-T case. Think of a long series on supermarket purchases for a large number of buyers. Or think of repeated visits to a website by the site's subscribers.
Time series are said to be nonstationary when they have a mean or variance that varies over time. Some nonstationary time series are stationary if you first difference them. Nonstationary time series tend to wander. Cointegration says that they wander together, meaning that there is a long-run equilibrium relationship among the series. And in Stata 15, we can now test for cointegration using the xtcointtest command.
xtcointtest tests for the presence of this long-run cointegration relationship. Three tests are available: Kao, Pedroni, and Westerlund.
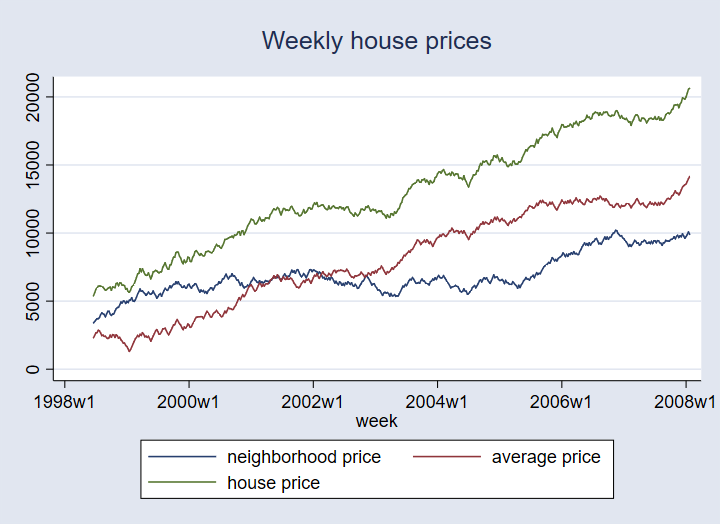
We have real-estate data and want to estimate the long-run relationship between prices of houses, neighboring house prices, and average house prices in each area. We believe that the housing market is volatile—that it is not stable—that the time series have a unit root—but we also believe that the prices have a stable long-run relationship.
Here is a graph that seems to substantiate our belief:
To test our intuition, we perform an Im-Pesaran-Shin unit-root test for the series. This is not part of the new xtcointtest that we want to show you, but the unit-root test should be performed first. We find that we cannot reject the null hypothesis that the panels have unit roots.
. xtunitroot ips hprice
| Ho: All panels contain unit roots | Number of panels = 700 |
| Ha: Some panels are stationary | Number of periods = 500 |
| AR parameter: Panel-specific | Asymptotics: T,N -> Infinity |
| Panel means: Included | sequentially |
| Time trend: Not included | |
| Fixed-N exact critical values |
| Statistic p-value 1% 5% 10% |
| t-bar -0.7598 -1.730 -1.670 -1.640 |
| t-tilde-bar -0.7582 |
| Z-t-tilde-bar 24.2109 1.0000 |
We have three prices in our data: hprice, nprice, and aprice. We showed you only the test for hprice, but we tested all three prices and obtained similar results.
Unit roots in hand, we now perform the Kao cointegration test:
. xtcointtest kao hprice aprice nprice

Kao test for cointegration

Ho: No cointegration                        Number of panels       =    700
Ha: All panels are cointegrated             Number of periods      =    498
| Cointegrating vector: Same Panel means: Included Kernel: Bartlett Time trend: Not included Lags: 3.54 (Newey-West) AR parameter: Same Augmented lags: 1 |
| Statistic p-value |
| Modified Dickey-Fuller t -1690.966 0.0000 Dickey-Fuller t -533.2073 0.0000 Augmented Dickey-Fuller t -362.3249 0.0000 Unadjusted modified Dickey-Fuller t -4106.424 0.0000 Unadjusted Dickey-Fuller t -624.8698 0.0000 |
The null hypothesis of no cointegration is rejected. This is true for the five tests statistics reported in the table and provides strong evidence that all panels in the data are cointegrated.
Not ones to give up, let's do some more tests. We want to show you the other xtcointtest features, and anyway, a reviewer might ask whether the above results are robust. xtcointtest just reported five statistics, but they are all related.
. xtcointtest pedroni hprice aprice nprice

Pedroni test for cointegration
| Ho: No cointegration Number of panels = 700 Ha: All panels are cointegrated Number of periods = 499 Cointegrating vector: Panel specific Panel means: Included Kernel: Bartlett Time trend: Not included Lags: 5.00 (Newey-West) AR parameter: Panel specific Augmented lags: 1 |
| Statistic p-value |
| Modified Phillips-Perron t -1779.0263 0.0000 Phillips-Perron t -675.1867 0.0000 Augmented Dickey-Fuller t -674.2714 0.0000 |
These related tests of cointegration work differently but allow us to come to the same conclusion: the panels are cointegrated.
The Westerlund test uses yet another approach, one that imposes fewer restrictions. It tests the same null hypothesis, but the alternative hypothesis is different, namely, that some (not necessarily all) of the panels are cointegrated.
. xtcointtest westerlund hprice aprice nprice

Westerlund test for cointegration
| Ho: No cointegration Number of panels = 700 Ha: Some panels are cointegrated Number of periods = 500 Cointegrating vector: Panel specific Panel means: Included Time trend: Not included AR parameter: Panel specific |
| Statistic p-value |
| Variance ratio -30.6619 0.0000 |
This test also rejects the null.
Learn more about Stata's panel-data features.
See [XT] xtcointtest for more information.