1 item has been added to your cart.
Stata users often need to create Word, PDF, or HTML files to report on what they have done. Stata 15 provides three new commands for doing that:
| New Command | Purpose |
|---|---|
| putpdf | Create PDF files | putdocx | Create Word documents |
| dyndoc | Create HTML from Markdown |
Here we tell you about putpdf.
Many organizations produce daily, weekly, or monthly reports that are disseminated as PDF (.pdf) files. Until now, a typical workflow might be to have an entire automated analysis in Stata followed by manual copying and pasting of results from Stata to Word or a LaTeX document that is then translated to a PDF.
Stata 15 introduces the putpdf command, which allows you to automate the production of PDF files. You can create files containing the following:
And you can control page size, page breaks, and document orientation.
Let's create this PDF file:
You can create do-files to automate the creation of files. You could create samplereport.do. We did. It contains
sysuse auto, replace
putpdf begin
// Create a paragraph
putpdf paragraph
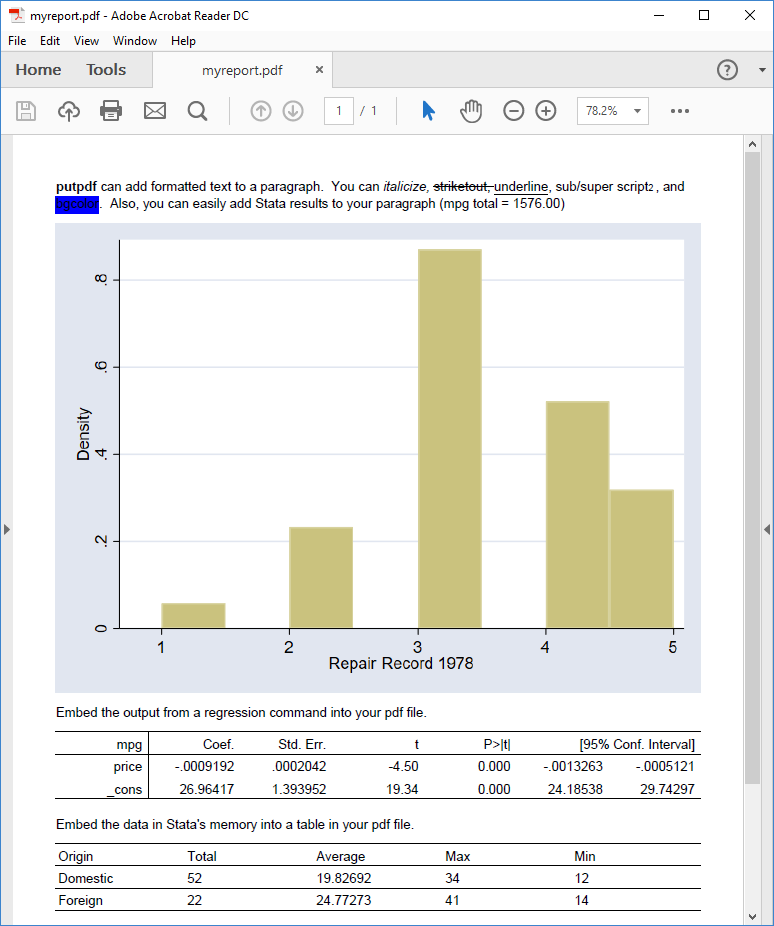
putpdf text ("putpdf "), bold
putpdf text ("can add formatted text to a paragraph. You can ")
putpdf text ("italicize, "), italic
putpdf text ("striketout, "), strikeout
putpdf text ("underline"), underline
putpdf text (", sub/super script")
putpdf text ("2 "), script(sub)
putpdf text (", and ")
putpdf text ("bgcolor"), bgcolor("blue")
qui sum mpg
local sum : display %4.2f `r(sum)'
putpdf text (". Also, you can easily add Stata results to your paragraph (mpg total = `sum')")
// Embed a graph
histogram rep
graph export hist.png, replace
putpdf paragraph, halign(center)
putpdf image hist.png
// Embed Stata output
putpdf paragraph
putpdf text ("Embed the output from a regression command into your pdf file.")
regress mpg price
putpdf table mytable = etable
// Embed Stata dataset
putpdf paragraph
putpdf text ("Embed the data in Stata's memory into a table in your pdf file.")
statsby Total=r(N) Average=r(mean) Max=r(max) Min=r(min), by(foreign): summarize mpg
rename foreign Origin
putpdf table tbl1 = data("Origin Total Average Max Min"), varnames ///
border(start, nil) border(insideV, nil) border(end, nil)
putpdf save myreport.pdf, replace
We could have typed the commands interactively to make the file, but we put them in a do-file so that it would be easy to reproduce or even update our report.
To produce the file, we typed
. do samplereport
Read more about how to Create a PDF file in the Stata Reporting Reference Manual.