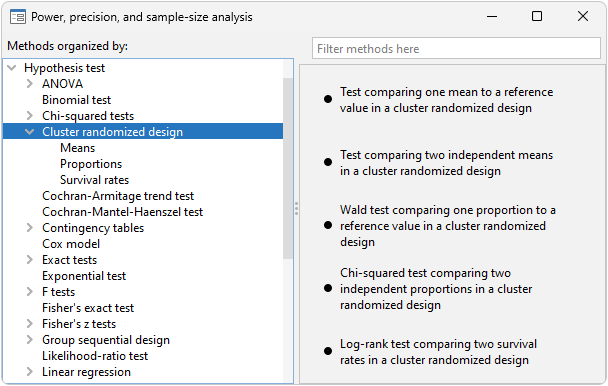
Five existing methods support cluster randomized designs (CRDs)
One-sample mean test
One-sample proportion test
Two-sample means test
Two-sample proportions test
Log-rank test
Multiple values of parameters
Automatic and customizable tables
Automatic and customizable graphs
Stata's power command performs power and sample-size analysis (PSS). Its features include PSS for cluster randomized designs (CRDs).
As with all other power methods, you may specify multiple values of parameters and automatically produce tabular and graphical results.
;)
Five power methods support CRDs or clustered data when you specify option cluster.
| Command | Description | |
| power onemean, cluster | One-sample mean test in a CRD | |
| power oneproportion, cluster | One-sample proportion test in a CRD | |
| power twomeans, cluster | Two-sample means test in a CRD | |
| power twoproportions, cluster | Two-sample proportions test in a CRD | |
| power logrank, cluster | Log-rank test in a CRD | |
In the presence of clustering, observations within the same cluster are correlated. In a CRD, groups of subjects (clusters) are randomized instead of individual subjects, which leads to clustering of subjects. With clustered data, the sample size is determined by the number of clusters and the cluster size. The sample-size determination involves either the determination of the number of clusters given cluster size or the determination of cluster size given the number of clusters. The commands compute one of the number of clusters, cluster size, power, or minimum detectable effect size given the other parameters, and they provide options to adjust for unequal cluster sizes. For two-sample methods, you can also adjust for unequal numbers of clusters in the two groups.
Suppose that we want to compare the means of body mass index (BMI) in two groups of patients with type-2 diabetes randomized to receive standard care (the control group) or patient-centered care (the treatment group). The randomization is applied to general practices that patients visit instead of to patients themselves. We want to compute the required number of clusters for the study. We want to detect the mean BMI of 32 in the treatment group if the mean BMI of the control group is 28, if the standard deviation is 5 in the two groups, and if the intraclass correlation is 0.5 (the default) in the two groups.
We anticipate at least 5 patients per practice in the control group and 10 in the treatment group. By default, power twomeans assumes a two-sided test with a 5% significance level and a power of 80%.
. power twomeans 28 32, m1(5) m2(10) sd(5)

Performing iteration ...

Estimated numbers of clusters for a two-sample means test
Cluster randomized design, z test assuming sd1 = sd2 = sd
Ho: m2 = m1  versus  Ha: m2 != m1

Study parameters:

        alpha =    0.0500
        power =    0.8000
        delta =    4.0000
           m1 =   28.0000
           m2 =   32.0000
           sd =    5.0000

Cluster design:

           M1 =         5
           M2 =        10
          rho =    0.5000

Estimated numbers of clusters and sample sizes:

           K1 =        15
           K2 =        15
           N1 =        75
           N2 =       150
We need to recruit 15 practices with a total of 75 patients in the control group and a total of 150 patients in the treatment group.
The default intraclass correlation of 0.5 may be too high for this type of study, and so we want to explore the required cluster size for a range of smaller intraclass correlations.
. power twomeans 28 32, m1(5) m2(10) sd(5) rho(0.1(0.1)0.5) graph
;)
By default, power plots the required number of clusters in the treatment group on the y axis. As the intraclass correlation increases from 0.1 to 0.5, the required number of practices in the treatment group increases from 6 to 15.
Learn more about Stata's power, precision, and sample-size features.
Read more about PSS for cluster randomized designs:
[PSS-2] power onemean, cluster [PSS-2] power twomeans, cluster [PSS-2] power oneproportion, cluster [PSS-2] power twoproportions, cluster [PSS-2] power logrank, cluster


