1 item has been added to your cart.
| Title | How do you reshape/transpose a table | |
| Author | Mia Lv, StataCorp |
In Stata, we can generate customizable tables, descriptive tables, and estimation tables using table, dtable, and etable, respectively. And any collect commands can be used after producing a table to further customize it. This is feasible because table/dtable/etable are implemented using collect.
When we are working on editing the tables, sometimes we want to transpose or change the layout of a table we have already obtained. For example, we have generated the following table using the code
. clear all

. webuse lbw
(Hosmer & Lemeshow data)

. dtable, by(race, nototals) nosample factor(low smoke, statistics( fvfrequency))
| Race |
| White Black Other |
| Birthweight<2500g 0 73 15 42 1 23 11 25 Smoked during pregnancy Nonsmoker 44 16 55 Smoker 52 10 12 |
But we want to transpose it so that it looks like the following;
| Birthweight<2500g Smoked during pregnancy |
| 0 1 Nonsmoker Smoker |
| Race |
| White 73 23 44 52 |
| Black 15 11 16 10 |
| Other 42 25 55 12 |
I know we probably can regenerate it from scratch. But can we transpose the previous table or change its layout without redoing everything? The answer is yes. Because dtable calls the collect suite of commands to build the table (so do etable and table), we can redefine the table layout using collect layout.
First, let’s review how collect layout and tags define a table structure.
collect is a new suite of commands introduced in Stata 17. A collection includes items and tags. Items are numbers or strings, and each item has one or more tags attached to it. Usually, tags are generated when you collect results from an estimation command or call table/dtable/etable.
Tags are dimensional-level pairs with the format dim[level], such as union[0], result[mean], where the first part is dimension and the second part is level. One dimension often has multiple levels. If we include a dimension without typing its level, such as var or result, we are including all of its autolevels (help collect style autolevels).
We define the table layout using the row, column, and table tags. But table tags are needed only if you create multiple tables at once. The syntax is
. collect layout (rows) (cols) (tabs)
The row tags, column tags, and table tags are included in the first, second, and third pair of parentheses, (), respectively. The order does matter! (If you do not have the table tags, you can omit the third (). If you do not have row tags, you can leave an empty pair of () there). Using these tags you specify here, Stata displays the uniquely identified items in each cell of a table. For example,
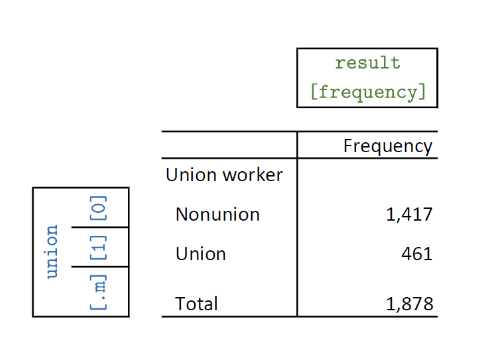
. webuse nlsw88
(NLSW, 1988 extract)

. table (union) (result)
generates the following table using the tags of union as rows, and the tags in result as columns. The union dimension has three levels, 0, 1, and .m (the total level). The dimension result has only one level frequency. Each number in the table must have both the associated row tag and column tag to be displayed properly. For example, the number 461 is shown because it has both tags union[1] and result[frequency] attached to it.
Now, let's go back to the table transposing problem we raised at the top of this FAQ. The first method to change the layout is using the syntax of collect layout. First, we need to obtain the current table layout. We can type
. collect layout
after any collect or table/dtable/etable command. The current layout specification will be displayed, and the table will be presented as well. After the code we showed at the beginning, typing this command issues the following output:
. collect layout

Collection: DTable
      Rows: var
   Columns: race#result
   Table 1: 6 x 3
| Race |
| White Black Other |
| Birthweight<2500g |
| 0 73 15 42 |
| 1 23 11 25 |
| Smoked during pregnancy |
| Nonsmoker 44 16 55 |
| Smoker 52 10 12 |
According to the output, we know the rows are defined by the dimension var and the columns are defined by the dimension race#result (result nested within race). Sometimes, the layout has a third dimension “Table” (mainly for multiple tables), but that is not present here. And the collection for which we are fetching results is called DTable. In fact, we will define the same table again by typing the following syntax (we omit the collection name because it is the only collection we have created in memory),
. collect layout (var) (race#result)
(output omitted)
where the first () include the row tags and the second () include the column tags.
Now, let’s switch the content in the first () and the second (). Because we are using the original row tags to define columns, and the original column tags to define rows, the table is transposed.
. collect layout (race#result) (var)

Collection: DTable
      Rows: race#result
   Columns: var
   Table 1: 4 x 4
| Birthweight<2500g Smoked during pregnancy |
| 0 1 Nonsmoker Smoker |
| Race |
| White 73 23 44 52 |
| Black 15 11 16 10 |
| Other 42 25 55 12 |
The second method involves only pointing and clicking. So no coding!
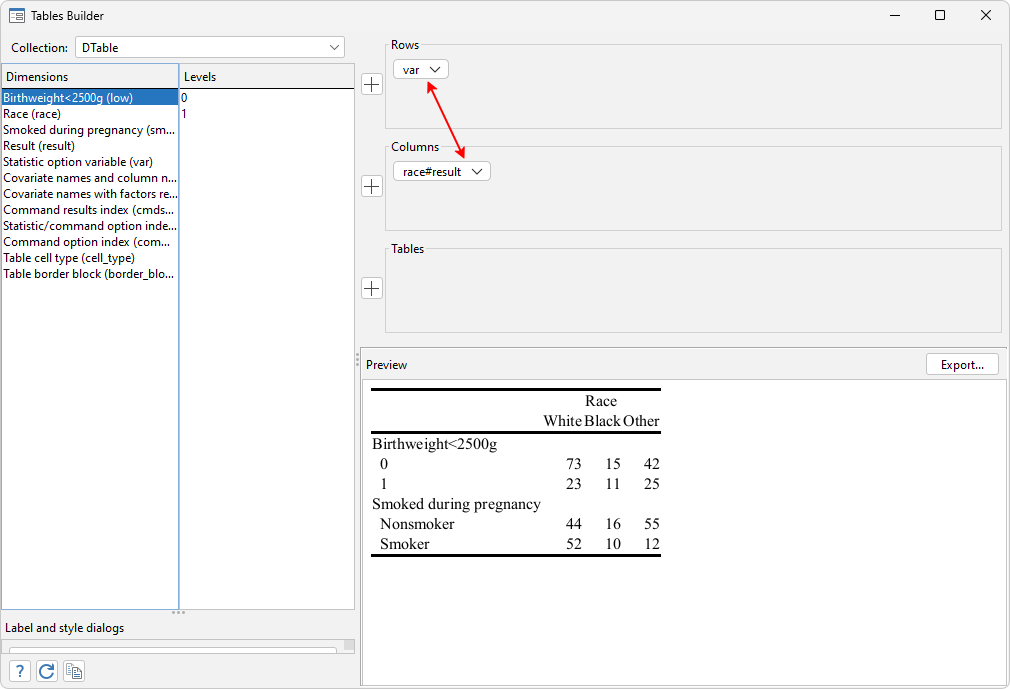
After obtaining the original table, open the Tables Builder using the menu Statistics > Summaries, tables, and tests > Tables and collections > Build and style table or by typing
. db tables
It opens the window of Tables Builder. Now, we use our mouse to select and drag the tag “var”, which is under “Rows”, to be under “Columns”. We select and drag “race#result”, which is under “Columns”, to be under “Rows”;
And now it looks like
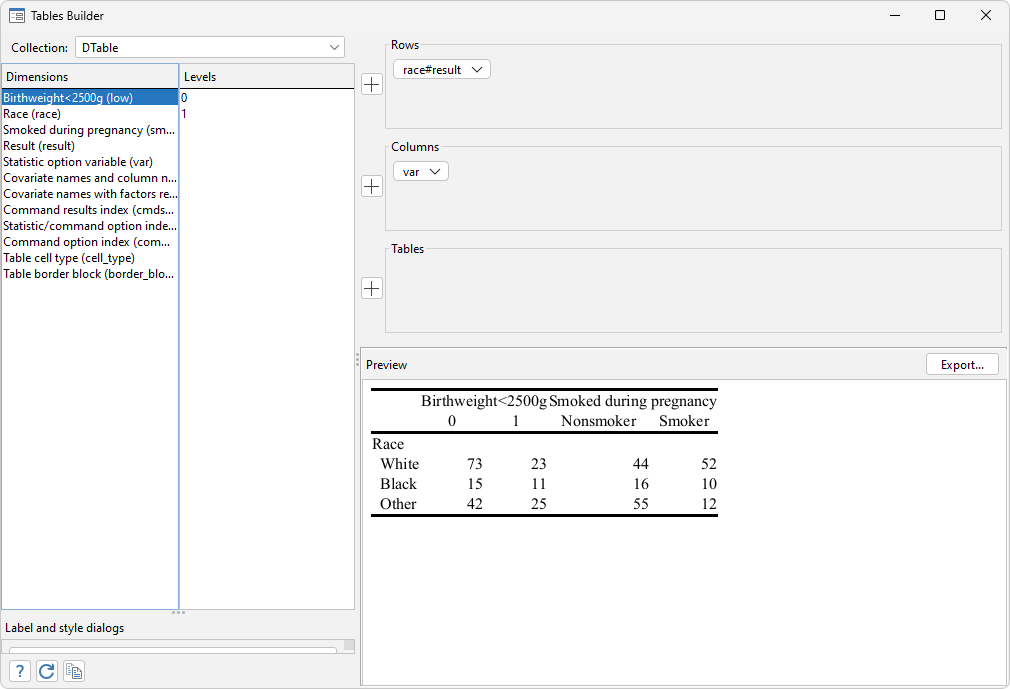
Now we can see the table in the preview window has reflected the changes we made. After this, you can click on the copy button on the lower left corner to save the equivalent collect layout syntax to the clipboard.

When you paste it, the command will show
. collect layout (race#result) (var) (), name(DTable)
You can save this command to your do-file to get reproducible results whenever you run the code in the future.
This method is also illustrated by the following YouTube tutorial:
Read more about tables in the Stata Customizable Tables and Collected Results Reference Manual.