
1 item has been added to your cart.
| Title | Making graphs come out square | |
| Author | Nicholas J. Cox, Durham University, UK |
Stata’s graphs are produced wider than high, “landscape” in one terminology. Naturally, this shape may not always be best. You might want a specific shape of graph for a report or a presentation; for example, with only a few variables or groups the box plots produced by graph, box look too fat to many eyes. These choices depend on your purposes and your tastes. In particular, some users may prefer a square shape, so this FAQ explains how to get square graph images. Once you know how to do that, you can produce other rectangular shapes.
The manual entry [G] gph and the on-line help for gph explains the bbox() option (think “bounding box”). This option takes a comma-separated list of seven numbers, which specify top, left, bottom, right, text height, text width, and rotation of the graph. Here we are only concerned with the first four. These specify the positions of the corners of the whole graph image, using a row and column system in which row numbers increase from top to bottom and column numbers increase from left to right. That is, a table or matrix convention is used, rather than a Cartesian coordinate convention.
                  (r_min,c_min)   (r_min,c_max)
                  (0,0)               (0,32000)
                    +-----------------------+
                    |                       |
                    |                       |
                    |                       |
                    |                       |
                    |                       |
                    +-----------------------+
                  (23063,0)       (23063,32000)
                  (r_max,c_min)   (r_max,c_max)
The whole graph image includes everything, including whatever titles you put on the top, left, bottom, and right of the data region, which is the rectangle defined by the graph axes. The precise size and shape of the data region will be sensitive to titles and other marginal material, including the space tuned by the gap() option, see help on graxes. Note it is not easy to control the exact position and shape of the data region without low-level programming using graph.
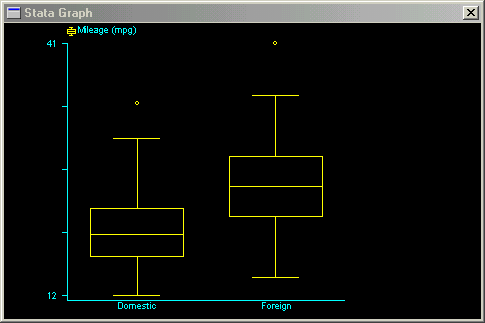
The default value of bbox() is (0,0,23063,32000,923,444,0), which sets the extent of the graph image to the maximum possible. From this, you can see that a square shape can be achieved by, for example, (0,0,23063, 23063, 923,444,0). (As said earlier, we are not concerned here with the last three arguments, controlling text height, width, and rotation.)
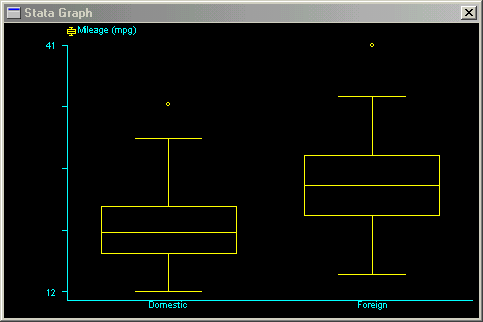
So, very simply, try this with the auto data:
        . sort foreign
        . graph mpg, by(foreign) box
. graph mpg, by(foreign) box bbox(0,0,23063,23063,923,444,0)
Clearly, you could produce other sizes and shapes by changing the four corner positions. If you wanted to do this repeatedly, you might want to keep the option arguments you desire in a global macro with a more concise and more memorable name, and then invoke it as needed:
        . global sq "bbox(0,0,23063,23063,923,444,0)"
        . graph mpg, by(foreign) box $sq
        . graph price, by(foreign) box $sq
You could have such a global macro automatically available if you defined it in a profile.do, as explained in the FAQ How can I automatically execute certain commands every time I start Stata? ( http://www.stata.com/support/faqs/programming/profile-do-file/).
The community-contributed program sqr, available from SSC-IDEAS, allows you to produce graphs that are square, or with any other aspect ratio within reason.


