
1 item has been added to your cart.
| Title | How to use the Graph Recorder in Stata to batch process graphs? | |
| Author | Mia Lv, StataCorp |
The Graph Editor is convenient to use when you want to customize your graphs without writing code. It allows you to edit the graph in an easy and flexible way without needing to know any syntax. But how do you reproduce the editing you have done previously in a new graph? You can record your edits and play them back on other graphs using the Graph Recorder.
In the Graph Editor, you can start recording your edits by clicking on
the Start recording button (  )
in the standard toolbar. All ensuing edits
are saved as a recording. To end a recording, you would need to
click on the same button. When you want to play the recording to
reproduce the changes with another graph, you can do it in three
different ways: 1. click the Play button from the Graph Editor’s
tool bar; or 2. use the command graph play; or 3. apply the
option play() with other graph-generating commands. We will use
several step-by-step examples below to illustrate how to use the Graph
Recorder.
)
in the standard toolbar. All ensuing edits
are saved as a recording. To end a recording, you would need to
click on the same button. When you want to play the recording to
reproduce the changes with another graph, you can do it in three
different ways: 1. click the Play button from the Graph Editor’s
tool bar; or 2. use the command graph play; or 3. apply the
option play() with other graph-generating commands. We will use
several step-by-step examples below to illustrate how to use the Graph
Recorder.
Let’s first generate a graph:
. webuse auto
. scatter mpg weight
Now we get a scatterplot that looks like this:
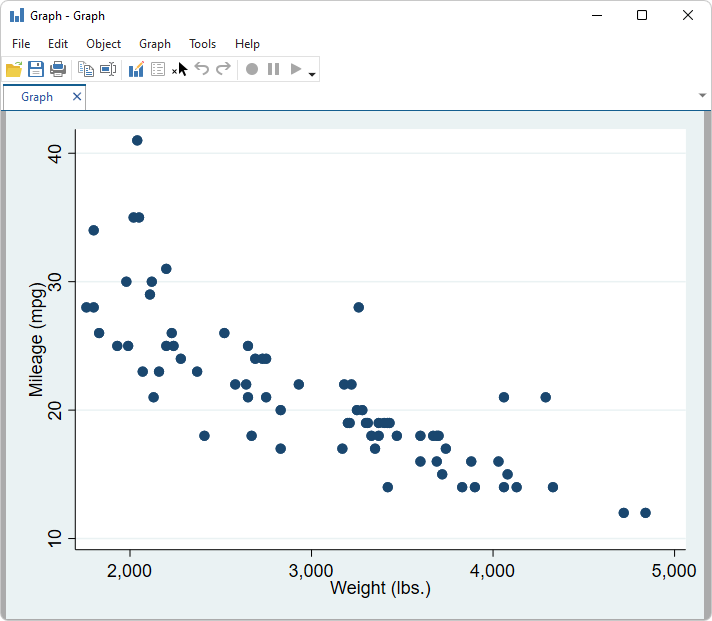
Click on the button with the bar graph and pencil icon in the toolbar to open the Graph Editor:

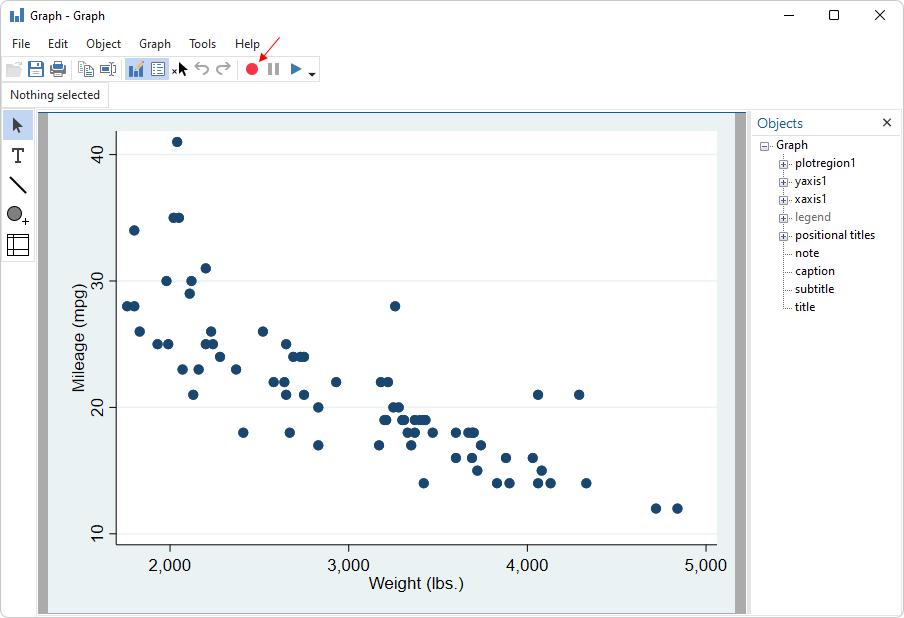
Now we see the Graph Editor is enabled. We can start the Graph Recorder by clicking on the button with the red dot icon.
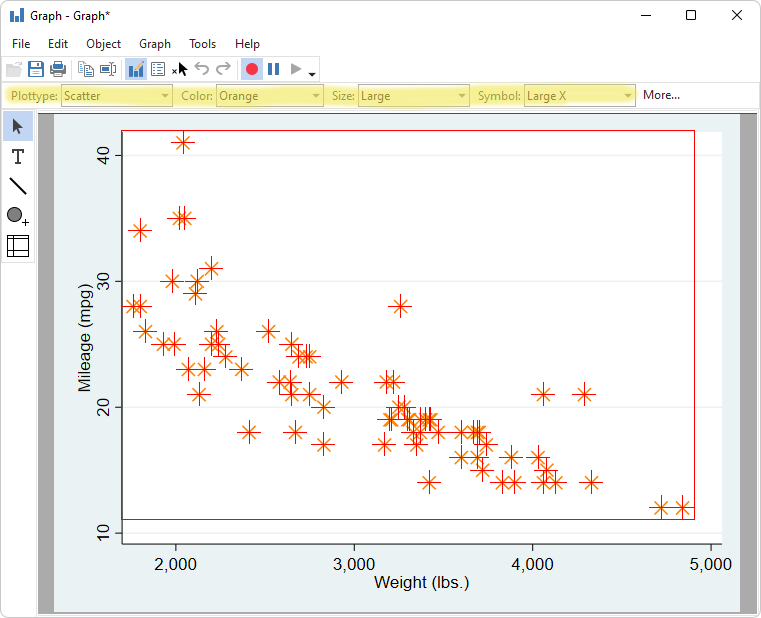
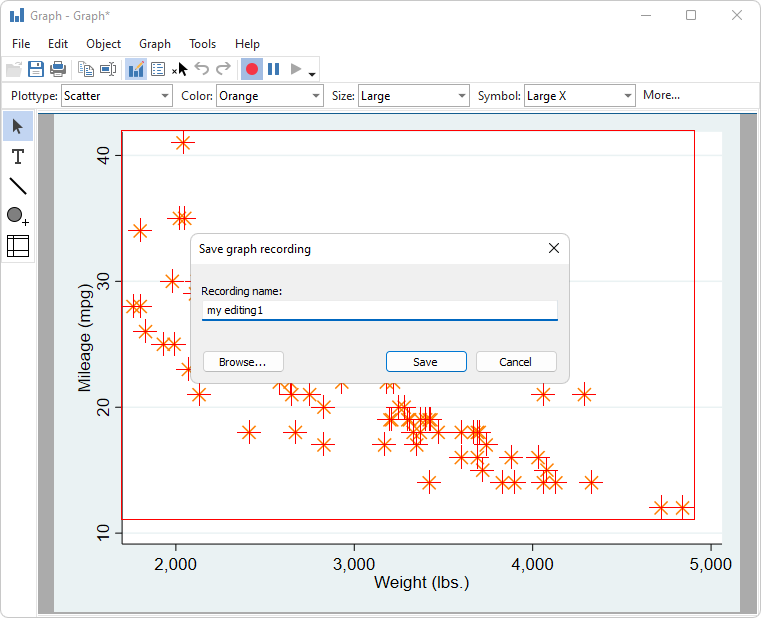
Next, we edit a few things such as the marker symbol and marker color. We first need to click on one of the points to tell the Graph Editor that we want to make changes to these markers. Then in the contextual toolbar, highlighted below, we change the Color: to Orange, the Size: to Large, and the Symbol: to a Large X.
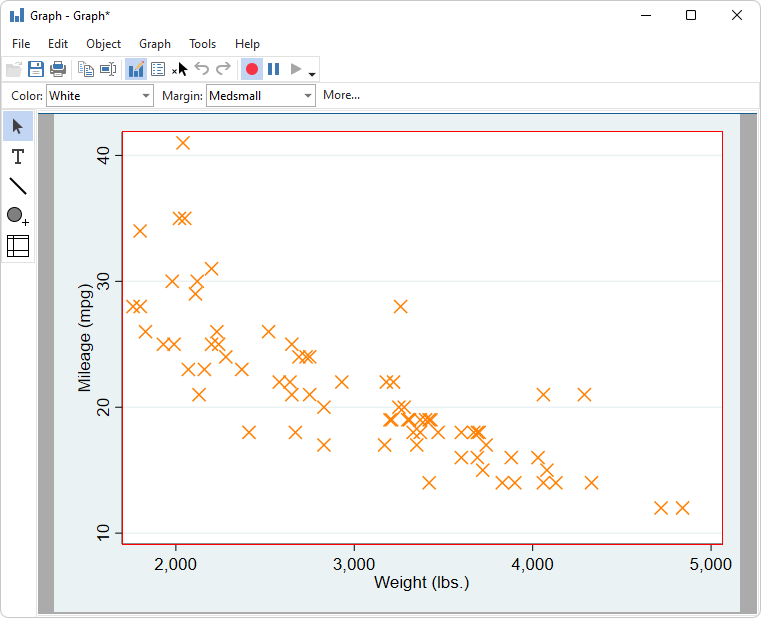
Next, click anywhere else on the graph to unselect the points so that we can see the selected symbol clearly (large X).
We could keep editing the graph, but we will stop here to focus on the way you can save the changes and use them with a different graph. Click on the same button we used to start recording to stop the recording. Enter a name for this recording. Let’s call it my editing1. Click on Save. Then, we can close this graph.
Now we want to apply the edits saved in the recording my editing1 to other graphs with similar elements. We can do that in three different ways.
1. Use the Play button on the Graph Editor.
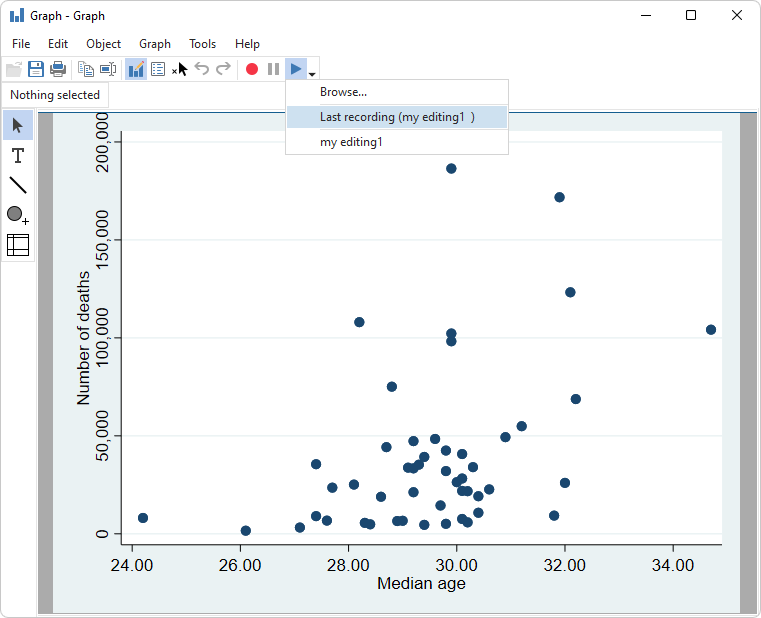
Let’s say we generate another graph using a different dataset.
. webuse census, clear
. scatter death medage
On the graph window, we open the Graph Editor and click on the Play button (which shows a right arrow). In the drop-down menu, we select the recording my editing1.
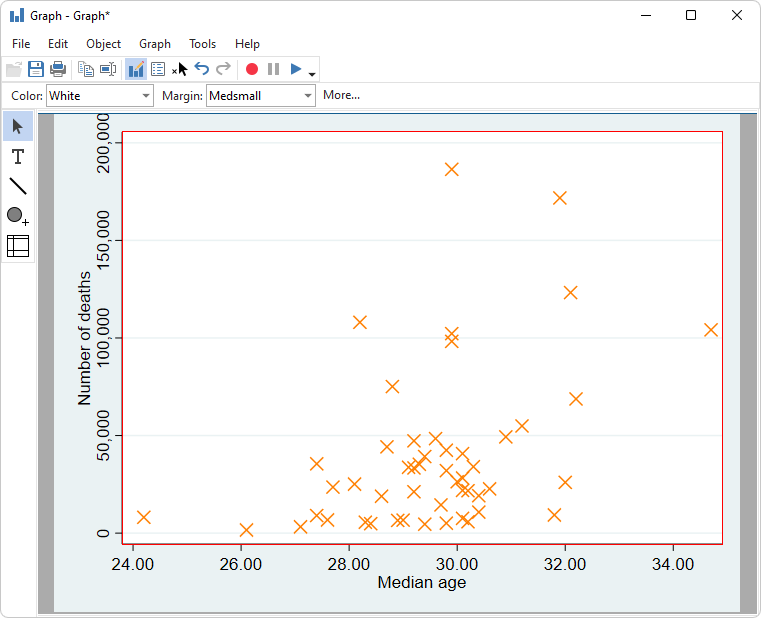
Now we can see the same edits have been applied to the current graph.
2. Use the command graph play.
We can also use commands to perform the same task instead of pointing and clicking. You can run graph play to apply the changes in the recording to the most recently generated graph.
. webuse census, clear
. scatter death medage
. graph play "my editing1"
Besides, you can play the recording to the graphs you saved on disk without regenerating or reopening it. Let’s say you have saved a graph on disk using the following code and closed your graph.
. webuse census, clear
. *save a graph in disk
. scatter death medage
. graph save g1, replace
. graph close
You come back later and continue working on this project. You can play the recording on this graph and save the edited graph using the following code.
. graph use g1, nodraw
. graph play "my editing1"
. graph save g1_edit,replace
If you have many graphs on disk that need to be edited, you can write a loop to automate this process so that you do not need to edit them one by one. Your code may look like this:
forvalues i=1/`n’{
  graph use g`i’, nodraw
  graph play "my editing1"
  graph save g`i’_edit,replace
}
3. Apply the play() option with graph-generating commands.
If you are going to generate a new graph and play the recording on this graph, you can specify the play() option with the command you use to generate the graph. So the graph will be generated with all the editing applied. For example:
. webuse census, clear
. scatter death medage, play("my editing1")


