
1 item has been added to your cart.
Stata's power provides power and sample-size (PSS) analysis. Six new methods are supported: three for contingency tables and three for survival analysis.
The new methods work just like the existing ones. You can compute power, sample size, and effect size. Enter any two and get the third. You can specify single values or, to compare multiple scenarios, ranges of values of study parameters. You can obtain results either in tabular form or as a graph.
Also, do not forget the three ANOVA methods and facilities to easily add your own new methods to power that we added in 13.1.
Stata's power provides three new methods for contingency-tables analysis.
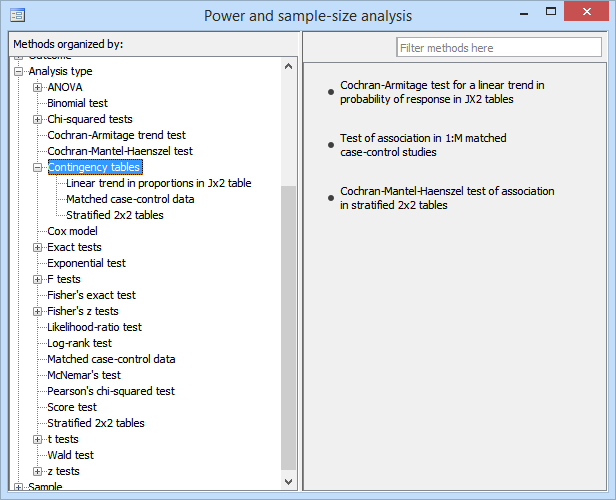
power cmh performs power and sample-size analysis for a Cochran–Mantel–Haenszel test of association in stratified 2x2 tables. It computes sample size, power, or effect size (common odds ratio) given other study parameters. It provides computations for designs with unbalanced stratum sizes as well as unbalanced group sizes within each stratum.
power mcc performs power and sample-size analysis for a test of association between a risk factor and a disease in 1:M matched case–control studies. It computes sample size, power, or effect size (odds ratio) given other study parameters.
power trend performs power and sample-size analysis for a Cochran–Armitage test of a linear trend in a probability of response in Jx2 tables. The rows of the table correspond to ordinal exposure levels. The command computes sample size or power given other study parameters. It provides computations for unbalanced designs and for unequally spaced exposure levels (doses). With equally spaced exposure levels, a continuity correction is available.
Here we demonstrate PSS for matched case–control studies. Consider cancer among smokers and nonsmokers. How many case–control pairs do we need to achieve 80% power of detecting a 1.7 odds ratio with a 5% significance test if we used a two-sided association test? From previous studies, the probability of exposure (smoking) for controls is known to be roughly 0.22. We type
. power mcc .22, oratio(1.7)

Performing iteration ...

Estimated sample size for a matched case-control study
Asymptotic z test, 1:1 matched design
Ho: OR = 1  versus  Ha: OR != 1

Study parameters:

        alpha =    0.0500
        power =    0.8000
        delta =    1.7000
           p0 =    0.2200
       oratio =    1.7000
         corr =    0.0000
            M =         1

Estimated sample size:

      N cases =       285
and learn that we need 285 cases (and 285 controls).
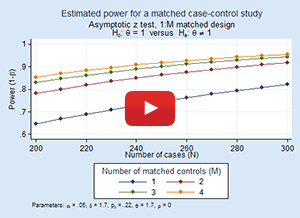
1:M matching is often used to reduce the required number of cases because cases are often more difficult to obtain than controls. It is thus useful to evaluate designs with different values of M.
We plot power curves for designs with 1:1, 1:2, 1:3, and 1:4 matching by typing
. power mcc 0.22, oratio(1.7) n(200(10)300) m(1 2 3 4) graph
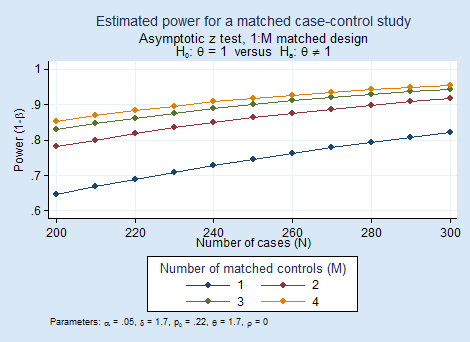
The graph reveals that as the number of matched controls increases, the power increases. The graph also suggests that the increase in power is substantial between M=1 and M=2 and becomes less beneficial after that.
In Stata 13, stpower provided power and sample-size analysis for survival studies. stpower's methods have now been integrated into power, meaning you now have the ability to obtain power and other curves automatically.
The three survival PSS methods are
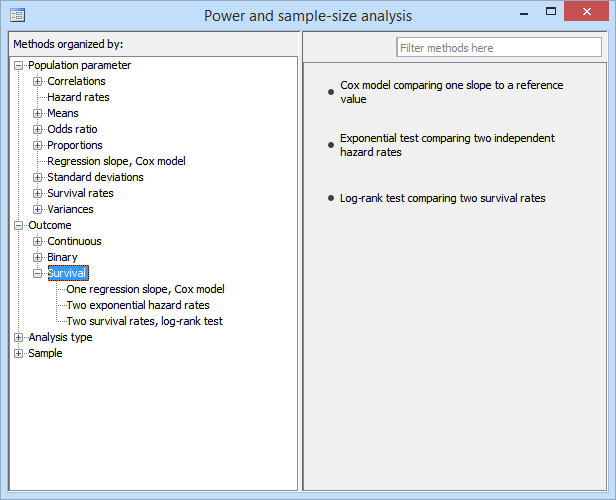
power cox estimates required sample size, power, and effect size for survival analysis using Cox PH models with possibly multiple covariates. It provides options to account for possible correlation between the covariate of interest and other predictors and for withdrawal of subjects from the study.
power exponential estimates required sample size and power for survival analysis comparing two exponential survivor functions using the exponential test (in particular, the Wald test of the difference between hazards or, optionally, of the difference between log hazards). It accommodates unequal allocation between the two groups, flexible accrual of subjects into the study (uniform and truncated exponential), and group-specific losses to follow-up.
power logrank estimates required sample size, power, and effect size for survival analysis comparing survivor functions in two groups using the log-rank test. It provides options to account for unequal allocation of subjects between the two groups, possible withdrawal of subjects from the study (loss to follow-up), and uniform accrual of subjects into the study.
Suppose we wish to compare the one-year survival rates of patients treated with a drug or placebo. We plan to use a one-sided log-rank test with 5% significance level. To explore the required sample sizes, we will look at the different powers and different increases in survival of the treated group:
. power logrank 0.5 (0.6 0.65 0.7), p(0.75(0.05)0.95) onesided graph
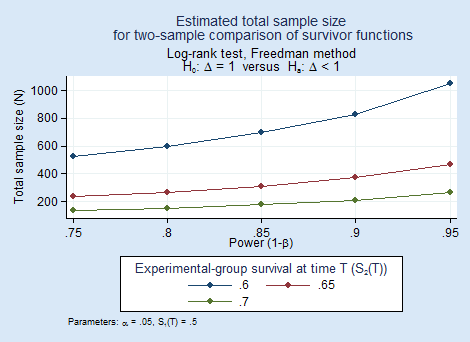
As expected, as power increases, sample size increases (but gently), and detecting smaller differences requires a substantially larger sample.
Learn much more about these new methods in Stata Power and Sample-Size Reference Manual. You will find many more worked examples, extended discussion, methods and formulas, references, and more. More than 150 pages are dedicated to the new methods for contingency tables and survival analysis.
Read the overview from the Stata News.
Upgrade now Order Stata


