
1 item has been added to your cart.
Multivariate GARCH models were introduced in Stata 11.
|
| Order |
Stata’s new dvech command estimates the parameters of multivariate generalized autoregressive conditional-heteroskedasticity (GARCH) models. Multivariate GARCH models allow the conditional covariance matrix of the dependent variables to follow a flexible dynamic structure. dvech estimates the parameters of diagonal vech GARCH models in which each element of the current conditional covariance matrix of the dependent variables depends only on its own past and on past shocks.
Here we analyze some fictional weekly data on the percentages of bad widgets found in the factories of Acme Inc. and Anvil Inc. We model the levels as a first-order autoregressive process. We believe that the adaptive management style in these companies causes the variances to follow a diagonal vech GARCH process with one ARCH term and one GARCH term.
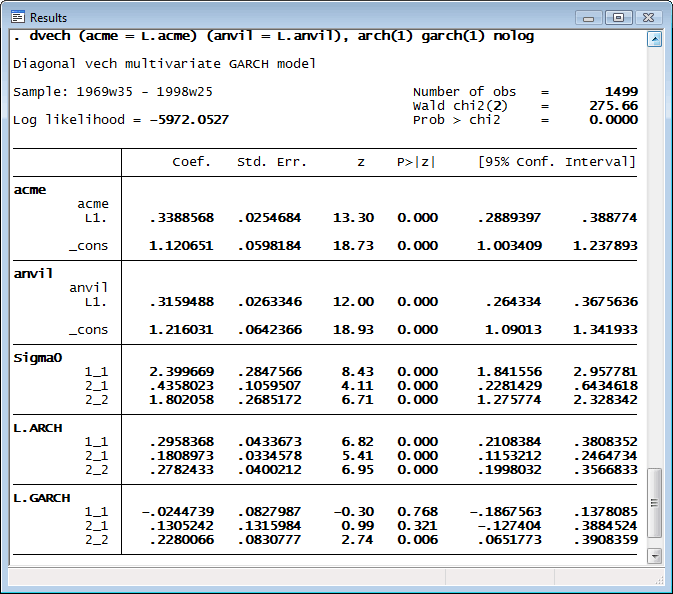
dvech supports constraints, so if we recognized that these close competitors might follow essentially the same process, we could have imposed the constraints that the ARCH coefficients are the same for the two companies and that the GARCH coefficients are also the same. We could estimate that model by typing
. constraint 1 [L.ARCH]1_1  = [L.ARCH]2_2
. constraint 2 [L.GARCH]1_1 = [L.GARCH]2_2
. dvech (acme = L.acme) (anvil = L.anvil), arch(1) garch(1) constraints(1 2)
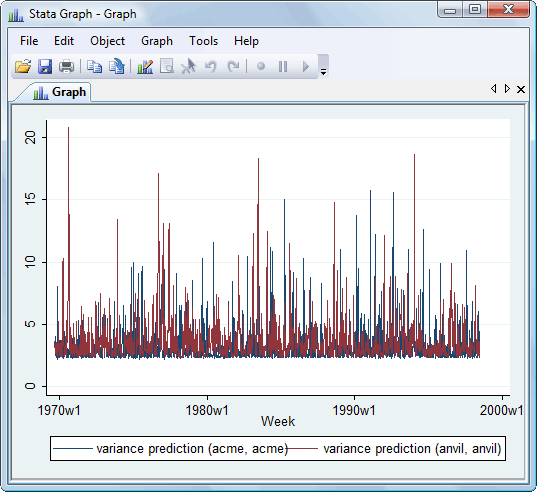
In addition to predicting the dependent variables, we can predict the conditional variance to observe the modeled volatility. Here we make one-step predictions of volatility over the sample and graph the results.
. predict v*, variance
. tsline  v_acme_acme v_anvil_anvil
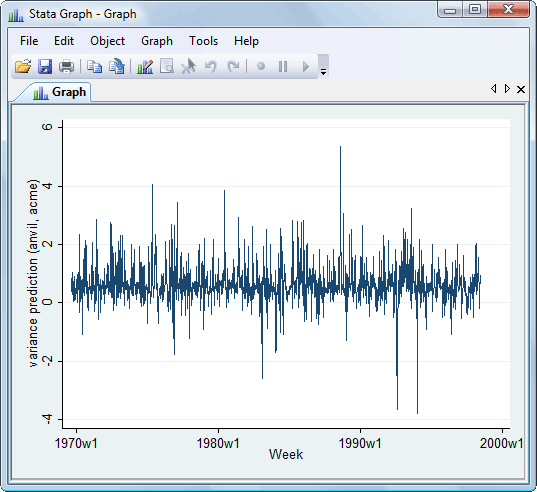
In the prediction above, we also predicted the conditional covariance between the two companies. Let’s graph that now,
. tsline v_anvil_acme
For a complete list of what’s new in time-series analysis, click here.


