

In the spotlight: Customizable tables in Stata 17
You asked for it—you got it! We expanded the functionality of the table command. We also developed an entirely new system that allows you to collect results from any Stata command, create custom table layouts and styles, save and use those layouts and styles, and export your tables to most popular document formats. We even added a new manual to show you how to use this powerful and flexible system.
Today, I'm going to show you how to use this new system to create a table of regression results and export it to Microsoft Word.
Below, I'll show you how to create, customize, and export this table with just a few commands. I will not explain all the commands and concepts in detail here, but I will give you more detail in my blog series. You can find the first posts at
Customizable tables in Stata 17, part 1: The new table command
Customizable tables in Stata 17, part 2: The new collect command
Table of regression results
Let's begin by typing webuse nhanes2l to open a new Stata 17 dataset based on the National Health and Nutrition Examination Survey data (NHANES).
. webuse nhanes2l
(Second National Health and Nutrition Examination Survey)

. describe age sex bmi highbp diabetes
| Variable Storage Display Value | ||||||
| name type format label Variable label | ||||||
Almost all Stata commands leave results in memory temporarily after you run them. The new customizable table system allows you to collect these results and use them to create tables. The example below creates a new collection named mytable and collects the results of a logistic regression model for high blood pressure (highbp).
. collect create mytable

. collect: logistic highbp c.age##i.sex i.diabetes bmi

Logistic regression                                    Number of obs =  10,349
                                                       LR chi2(5)    = 2507.35
                                                       Prob > chi2   =  0.0000
Log likelihood = -5795.9927                            Pseudo R2     =  0.1778
| highbp | Odds ratio Std. err. z P>|z| [95% conf. interval] | |||||
| age | 1.033714 .0019249 17.81 0.000 1.029948 1.037494 | |||||
| sex | ||||||
| Female | .152188 .0232806 -12.31 0.000 .1127638 .2053956 | |||||
| sex#c.age | ||||||
| Female | 1.027994 .00294 9.65 0.000 1.022248 1.033773 | |||||
| diabetes | ||||||
| Diabetic | 1.197894 .1269626 1.70 0.088 .973198 1.47447 | |||||
| bmi | 1.146828 .0059073 26.60 0.000 1.135308 1.158464 | |||||
| _cons | .0054089 .0008847 -31.91 0.000 .0039255 .007453 | |||||
We can then type collect dims to see what we collected.
. collect dims

Collection dimensions
Collection: mytable
| Dimension No. levels | ||||||
| Layout, style, header, label cmdset 1 coleq 1 colname 13 program_class 1 result 43 result_type 3 rowname 1 Header, label diabetes sex Style only border_block 4 cell_type 4 | ||||||
The output tells us that we created a collection named mytable. Our collection includes dimensions and each dimension has levels. Collections, dimensions, and levels are important concepts for building tables. The concept is similar to a dataset (collection) that contains variables (dimensions) that have categories (levels).
Our collection contains a dimension named result, which has 43 levels. We can type collect levelsof result to view the levels of the dimension result. The levels include things named N, _r_b_, and chi2. Levels that begin with "_r" refer to the reported statistics in the regression output, such as the coefficients or transformed coefficients (_r_b), their standard errors (_r_se), and their confidence intervals (_r_ci).
. collect levelsof result

Collection: mytable
 Dimension: result
    Levels: N N_cdf N_cds _r_b _r_ci _r_df _r_lb _r_p _r_se _r_ub _r_z chi2
            chi2type cmd cmdline converged depvar df_m estat_cmd ic k k_dv
            k_eq k_eq_model ll ll_0 marginsnotok marginsok ml_method mns opt p
            predict properties r2_p rank rc rules technique title user vce
            which
Let's type collect levelsof colname to view the levels of the dimension colname.
. collect levelsof colname

Collection: mytable
 Dimension: colname
    Levels: age 1.sex 2.sex 1.sex#age 2.sex#age 0.diabetes 1.diabetes bmi c1
            c2 c3 c4 _cons
The levels of the dimension colname contain the independent variables in our model, including any interactions. Levels can have labels, and we can view them by typing collect label list colname. I will show you how to customize these labels later.
. collect label list colname

  Collection: mytable
   Dimension: colname
       Label: Covariate names and column names
Level labels:
       _cons  Intercept
         age  Age (years)
         bmi  Body mass index (BMI)
    diabetes  Diabetes status
         sex  Sex
Now that we know how the regression results are stored in the collection, we can use collect layout to create a table using the dimensions in our collection. The basic syntax is
collect layout (RowDimensions) (ColumnDimensions)
We can specify the levels of the dimensions by using square brackets:
collect layout (RowDimensions[Levels]) (ColumnDimensions[Levels])
The example below uses collect layout to create a table using the row dimension colname and the column dimension result. Note that I have only included the levels _r_b (the transformed coefficients—the odds ratios), _r_se (the standard errors), _r_z (the z statistics), _r_p (the p-values), and _r_ci (the confidence interval) for the column dimension result.
. collect layout (colname) (result[_r_b _r_se _r_z _r_p _r_ci])

Collection: mytable
      Rows: colname
   Columns: result[_r_b _r_se _r_z _r_p _r_ci]
   Table 1: 9 x 5
| Coefficient Std. error z p-value 95% CI | ||||||
| Age (years) | 1.033714 .0019249 17.81 0.000 1.029948 1.037494 | |||||
| Male | 1 0 | |||||
| Female | .152188 .0232806 -12.31 0.000 .1127638 .2053956 | |||||
| Male # Age (years) | 1 0 | |||||
| Female # Age (years) | 1.027994 .00294 9.65 0.000 1.022248 1.033773 | |||||
| Not diabetic | 1 0 | |||||
| Diabetic | 1.197894 .1269626 1.70 0.088 .973198 1.47447 | |||||
| Body mass index (BMI) | 1.146828 .0059073 26.60 0.000 1.135308 1.158464 | |||||
| Intercept | .0054089 .0008847 -31.91 0.000 .0039255 .007453 | |||||
Now we can customize the style of our table. Let's begin by using collect style cell to format the numbers in our table. We can refer to the numbers we wish to customize by using their dimension and levels. For example, we can refer to the coefficients and standard errors by typing result[_r_b _r_se] or to the p-values by typing result[_r_p]. Then we can type collect preview to view our changes.
. collect style cell result[_r_b _r_se], nformat(%6.2f)

. collect style cell result[_r_p], nformat(%5.4f)

. collect preview
| Coefficient Std. error z p-value 95% CI | ||||||
| Age (years) | 1.03 0.00 17.81 0.0000 1.029948 1.037494 | |||||
| Male | 1.00 0.00 | |||||
| Female | 0.15 0.02 -12.31 0.0000 .1127638 .2053956 | |||||
| Male # Age (years) | 1.00 0.00 | |||||
| Female # Age (years) | 1.03 0.00 9.65 0.0000 1.022248 1.033773 | |||||
| Not diabetic | 1.00 0.00 | |||||
| Diabetic | 1.20 0.13 1.70 0.0884 .973198 1.47447 | |||||
| Body mass index (BMI) | 1.15 0.01 26.60 0.0000 1.135308 1.158464 | |||||
| Intercept | 0.01 0.00 -31.91 0.0000 .0039255 .007453 | |||||
We can also customize the confidence intervals by using collect style cell. The option nformat(%5.2f) formats the numbers, sformat("[%s]") places square brackets around the numbers, and cidelimiter(,) places a comma between the lower and upper bounds.
. collect style cell result[_r_ci],
                    nformat(%5.2f)
                    sformat("[%s]")
                    cidelimiter(,)

. collect preview
| Coefficient Std. error z p-value 95% CI | ||||||
| Age (years) | 1.03 0.00 17.81 0.0000 [1.03, 1.04] | |||||
| Male | 1.00 0.00 | |||||
| Female | 0.15 0.02 -12.31 0.0000 [0.11, 0.21] | |||||
| Male # Age (years) | 1.00 0.00 | |||||
| Female # Age (years) | 1.03 0.00 9.65 0.0000 [1.02, 1.03] | |||||
| Not diabetic | 1.00 0.00 | |||||
| Diabetic | 1.20 0.13 1.70 0.0884 [0.97, 1.47] | |||||
| Body mass index (BMI) | 1.15 0.01 26.60 0.0000 [1.14, 1.16] | |||||
| Intercept | 0.01 0.00 -31.91 0.0000 [0.00, 0.01] | |||||
Next we can use collect label levels to change the column labels from "Coefficient" to "OR" and from "Std. error" to "SE". We can use collect style cell to center-align the column headers, and we can use collect style column to add extra space between the columns.
. collect label levels result _r_b "OR", modify

. collect label levels result _r_se "SE", modify

. collect style cell cell_type[column-header], halign(center)

. collect style column, extraspace(1)

. collect preview
| OR SE z p-value 95% CI | ||||||
| Age (years) | 1.03 0.00 17.81 0.0000 [1.03, 1.04] | |||||
| Male | 1.00 0.00 | |||||
| Female | 0.15 0.02 -12.31 0.0000 [0.11, 0.21] | |||||
| Male # Age (years) | 1.00 0.00 | |||||
| Female # Age (years) | 1.03 0.00 9.65 0.0000 [1.02, 1.03] | |||||
| Not diabetic | 1.00 0.00 | |||||
| Diabetic | 1.20 0.13 1.70 0.0884 [0.97, 1.47] | |||||
| Body mass index (BMI) | 1.15 0.01 26.60 0.0000 [1.14, 1.16] | |||||
| Intercept | 0.01 0.00 -31.91 0.0000 [0.00, 0.01] | |||||
Next we can customize the row labels. We can remove the base levels from the factor variables by typing collect style showbase off. We can use collect style row to stack the dimension levels below the dimension name (stack), remove the "=" between the dimensions and their levels (nobinder), and change the interaction delimiter from "#" to "x" (delimiter(" x ")).
. collect style showbase off

. collect style row stack, nobinder delimiter(" x ")

. collect preview
| OR SE z p-value 95% CI | ||||||
| Age (years) | 1.03 0.00 17.81 0.0000 [1.03, 1.04] | |||||
| Sex | ||||||
| Female | 0.15 0.02 -12.31 0.0000 [0.11, 0.21] | |||||
| Sex x Age (years) | ||||||
| Female | 1.03 0.00 9.65 0.0000 [1.02, 1.03] | |||||
| Diabetes status | ||||||
| Diabetic | 1.20 0.13 1.70 0.0884 [0.97, 1.47] | |||||
| Body mass index (BMI) | 1.15 0.01 26.60 0.0000 [1.14, 1.16] | |||||
| Intercept | 0.01 0.00 -31.91 0.0000 [0.00, 0.01] | |||||
The vertical line between the row labels and odds ratios is a border along the right side of the first column. We can use collect style cell to remove this vertical line.
. collect style cell border_block, border(right, pattern(nil))

. collect preview
| OR SE z p-value 95% CI | ||||||
| Age (years) 1.03 0.00 17.81 0.0000 [1.03, 1.04] Sex Female 0.15 0.02 -12.31 0.0000 [0.11, 0.21] Sex x Age (years) Female 1.03 0.00 9.65 0.0000 [1.02, 1.03] Diabetes status Diabetic 1.20 0.13 1.70 0.0884 [0.97, 1.47] Body mass index (BMI) 1.15 0.01 26.60 0.0000 [1.14, 1.16] Intercept 0.01 0.00 -31.91 0.0000 [0.00, 0.01] | ||||||
Exporting tables to documents
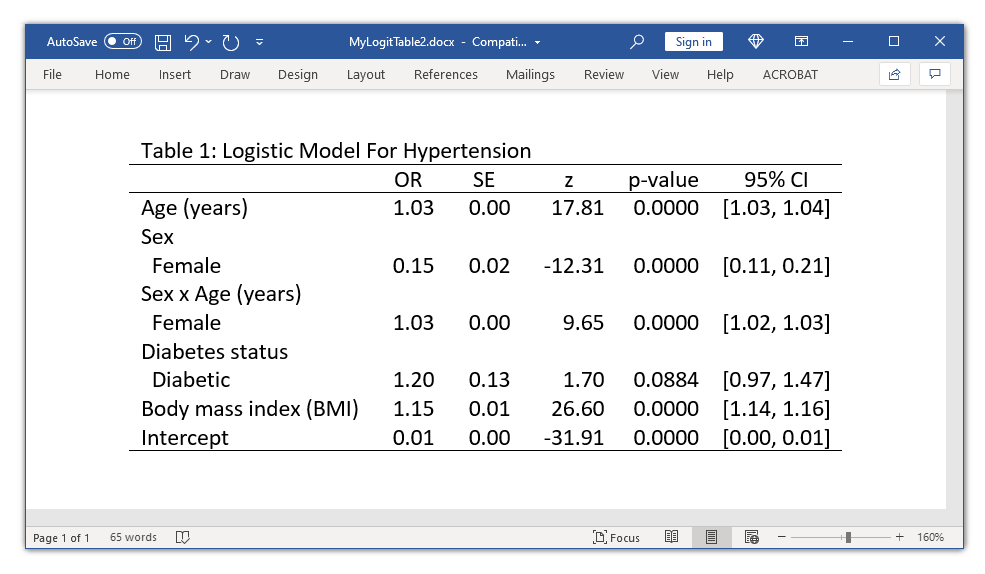
Now we're ready to export our table to a Microsoft Word document. We can use collect style putdocx to customize the style of our table in the Word document. By default, Word will stretch our table across the width of the document. We can prevent this with the layout(autofitcontents) option, and we can use title() to add a title to our table. Then we can export our table to Word by using collect export.
. collect style putdocx, layout(autofitcontents)
                        title("Table 1: Logistic Model For Hypertension")

. collect export MyLogitTable2.docx, as(docx) replace
(collection mytable exported to file MyLogitTable1.docx)
You can use putdocx collect to export your table if you are using putdocx to create a larger Word document.
You can also export tables to Excel, HTML, LaTeX, Markdown, PDF, Stata SMCL, and plain text.
Save and use your styles and labels
Once we are happy with the look of our table, we can save the style and labels and reuse them for other tables. We can use collect label save and collect style save to save our labels and styles, respectively.
. collect label save MyLogitLabels, replace
(labels from mytable saved to file MyLogitLabels.stjson)

. collect style save MyLogitStyle, replace
(style from mytable saved to file MyLogitStyle.stjson)
Then we can open another dataset and apply our styles and labels to another model.
. webuse lbw, clear
(Hosmer & Lemeshow data)

. collect style use MyLogitStyle, replace layout
(dimension colname not found)
(dimension result not found)

Collection: mytable
      Rows: colname
   Columns: result[_r_b _r_se _r_z _r_p _r_ci]

. collect label use MyLogitLabels, replace

. quietly collect: logistic low age i.smoke i.race ht ui

. collect preview
| OR SE z p-value 95% CI |
| Age (years) 0.97 0.03 -0.90 0.3705 [0.91, 1.04] Smoked during pregnancy Smoker 2.93 1.12 2.81 0.0049 [1.39, 6.20] Race Black 2.71 1.36 1.99 0.0468 [1.01, 7.26] Other 2.83 1.18 2.48 0.0130 [1.24, 6.41] Has history of hypertension 3.87 2.43 2.16 0.0309 [1.13,13.25] Presence, uterine irritability 2.66 1.17 2.22 0.0267 [1.12, 6.32] Intercept 0.26 0.24 -1.48 0.1376 [0.04, 1.54] |
We can see that row and column layout, numeric formats, alignment, treatment of factor variables, and labels are automatically applied from the saved style and label files.
Conclusion
Customizable tables in Stata 17 will help you streamline your workflow and speed up document production. You can save custom styles for different journals or reporting agencies and reformat large documents quickly and easily. And here we have barely scratched the surface of the power and flexibility of customizable tables in Stata 17.
The new Customizable Tables and Collected Results Reference Manual includes examples that show you how to create a "classic table 1", create a table of t-test results, compare the results of several regression models, and much more. We have also added videos to the Stata YouTube Channel that show you how to use the table dialog box and the Tables Builder. And we will be adding posts about customizable tables to the Stata Blog soon.
— Chuck Huber
Director of Statistical Outreach


