

In the spotlight: Scheming your way to your favorite graph style
You want a graph that most effectively communicates your message. You want a graph that fits the style of your journal. You want a graph with colors that everyone can differentiate. Or you want a graph in grayscale.
In any case, you start with a graph of your data or results, and you need to transform that graph into the style you want.
To demonstrate, I use a graph with overlaid scatterplots, model fit lines, and a confidence interval. To obtain the graph, I type
. twoway scatter observed1 observed2 day , color(%8 %8)    ||
         line    ols ar1 day              ,                 ||
         rarea   ul ll day                , color(gray%20)
         title(Seasonal Adjustment Factor)
This graph mostly uses Stata's defaults. The one exception is the transparency in the scatterplot markers and confidence interval area I requested using %8 and %20 within the color() option.
With this command, I get

Or with the same twoway command, I might get any of the following graphs.


What produces these differences? Schemes.
By changing the graph scheme, I can easily change the overall look of my graph. To obtain the set of graphs above, I typed
. set scheme economist

. set scheme s1rcolor

. set scheme plottig

. set scheme plotplain

. set scheme uncluttered

. set scheme lean2
and following each of these set scheme commands, I ran the twoway command again.
The s2color scheme is the default when you install Stata. This is the scheme that created the graph at the top. The set scheme command changes the default graph style. Stata provides 11 schemes from which you can choose; these schemes are discussed in [G-4] schemes intro. This is where you will find information on using the economist and s1rcolor schemes that I used above.
The schemes provided by Stata are only a starting point. Many members of Stata's user community have also contributed schemes. For instance, the plottig and plotplain schemes that I used were created by Daniel Bischof and described in his Stata Journal article "New graphic schemes for Stata: plotplain and plottig". The uncluttered scheme was provided by Gray Kimbrough. The lean2 scheme was created by Svend Juul and is discussed in his Stata Journal article "Lean mainstream schemes for Stata 8 graphics". If you like the style of one of the last four graphs, you can simply download and install the corresponding scheme and set it as your scheme before creating your graphs. If none of these schemes create the style you want, try typing search scheme in Stata to locate and install other schemes.
And if none of those schemes are quite what you had in mind, you can write your own scheme. To learn about this, type
. help scheme files
in Stata. Then, look at Vince Wiggins' talk "Scheming your way to consistent graphs" from the 2006 UK Stata Users Group meeting. It will guide you through the process.
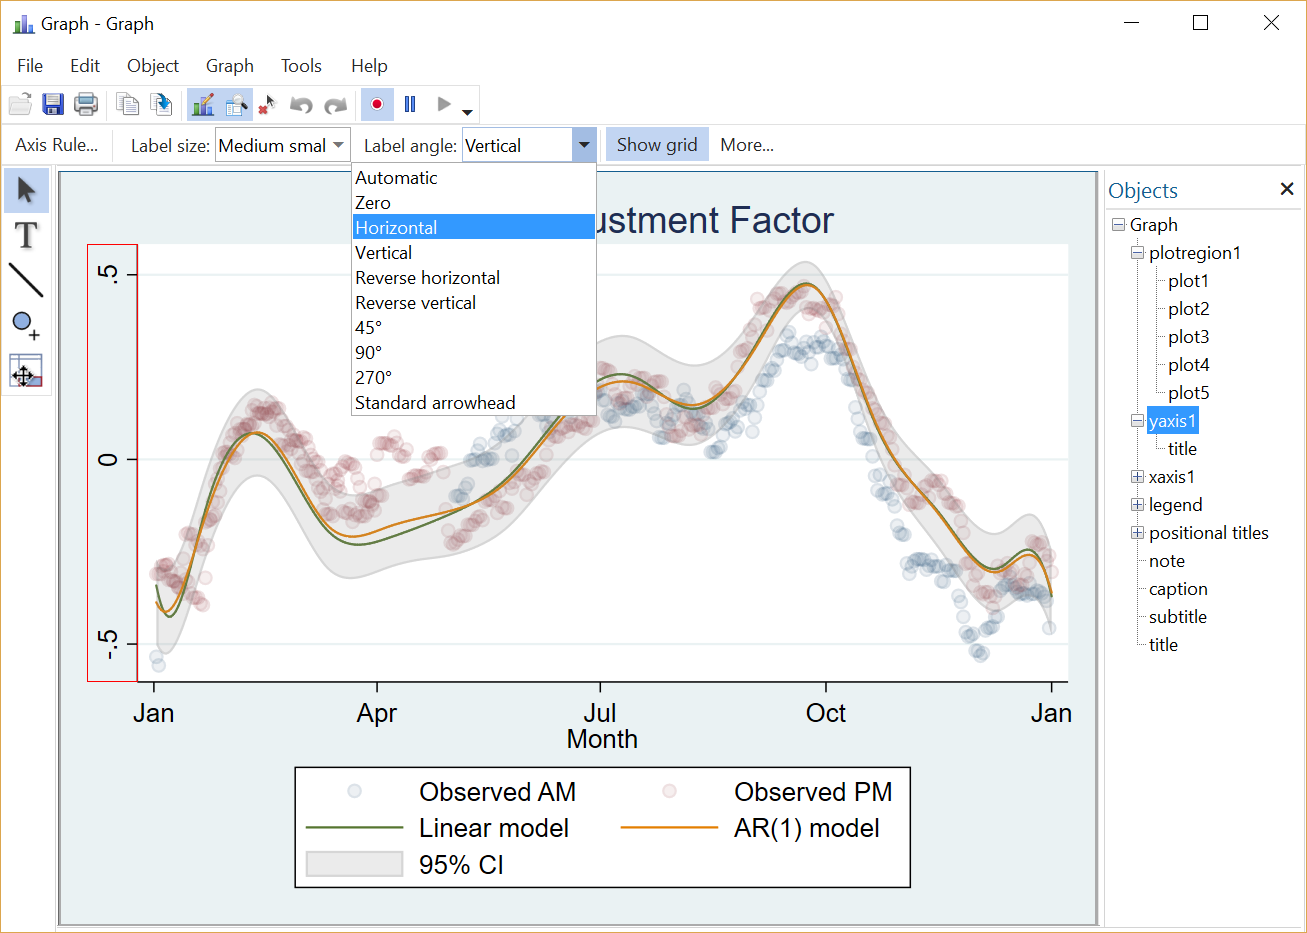
Don't want to write code to create a customized graph style? You can point and click to accomplish the same goal. You start by drawing a graph. Then, open the Graph Editor and make your changes. If these are changes that you would like to apply to many other graphs, record them. See the red dot in the menu below? Click on it to start the Graph Recorder, and record the changes as you make them.
When you finish, you can give recording a name such as "recording1". Then the next time you draw a graph, say
. twoway scatter y x
you can use graph play to apply the same changes,
. graph play recording1
Or use the play() option when you create the graph.
. twoway scatter y x, play(recording1)
Kevin Crow explains more in his Stata Journal article "Stata tip 72: Using the Graph Recorder to create a pseudograph scheme". You can also look at our YouTube video that demonstrates how to record changes and play the recording on other graphs.
So if you want to change the style of your graphs, try one of Stata’s other schemes, one of the schemes contributed by the community, a scheme you have written yourself, or perhaps a recording from the Graph Editor. Whatever your approach, you can scheme your way to the style of graphs that you like best.
— Kristin MacDonald
Director of Statistical Services


