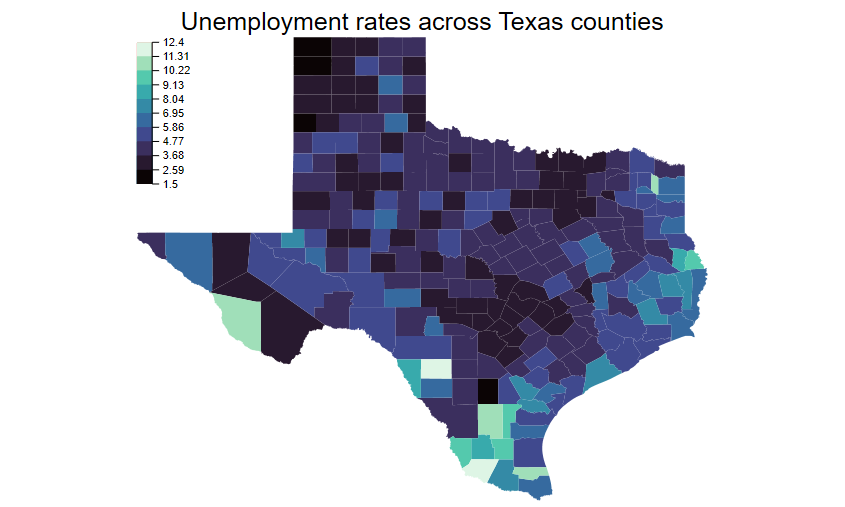
Community corner: Creating maps with geoplot
Are you working with spatial data? Want to clearly communicate how your data or results change across regions? Ben Jann's new mapping command, geoplot, makes this easy.
With this command, you can create powerful maps that include many layers—combining borders, roads, rivers, and much more onto one map. You can also take advantage of many customizations such as selecting from a wide variety of color palettes, modifying labels and legends, and zooming in on specific layers. And if you have created overlaid graphs using the twoway command in Stata, then you will find the syntax of geoplot very familiar.
To learn more about geoplot and see it in action, take a look at Ben's GitHub page, his talk from the 2023 UK Stata Conference, and Asjad Naqvi's guide on Medium. And then try creating your own maps.