

In the spotlight: Creating dynamic HTML documents with Stata output
Do you need to create a nicely formatted document with Stata output? Perhaps one that needs to be continually updated? Or maybe you need an easy way to share your Stata results with colleagues, perhaps non-Stata users?
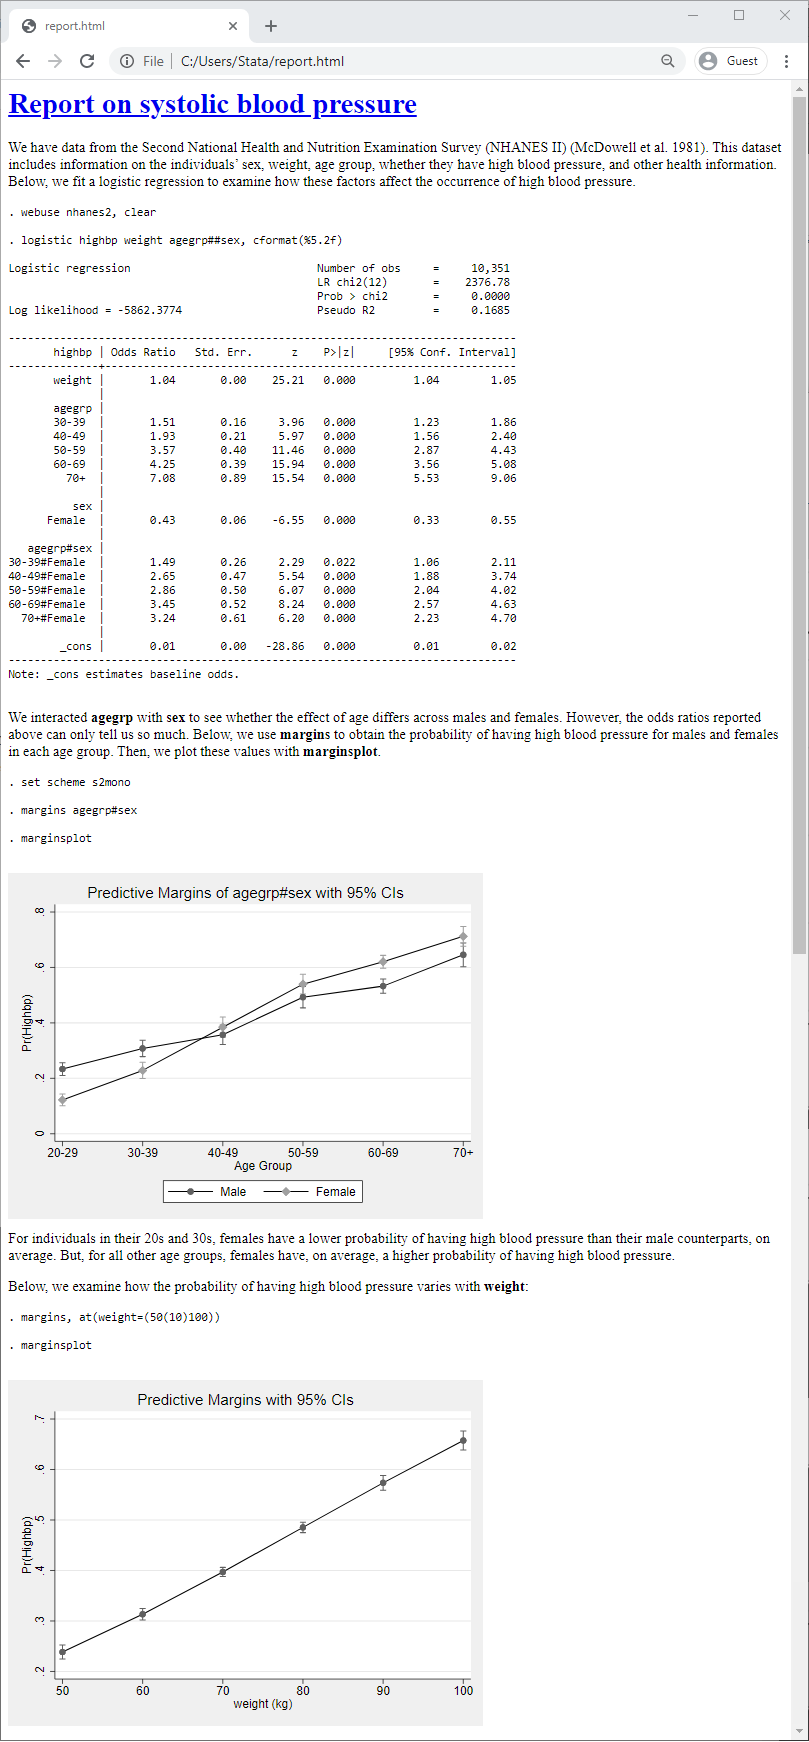
One way you can do this is by creating an HTML file with Stata output by using dyndoc. This command allows you to combine Markdown-formatted text and Stata output. For example, we used dyndoc to create this file called report.html:
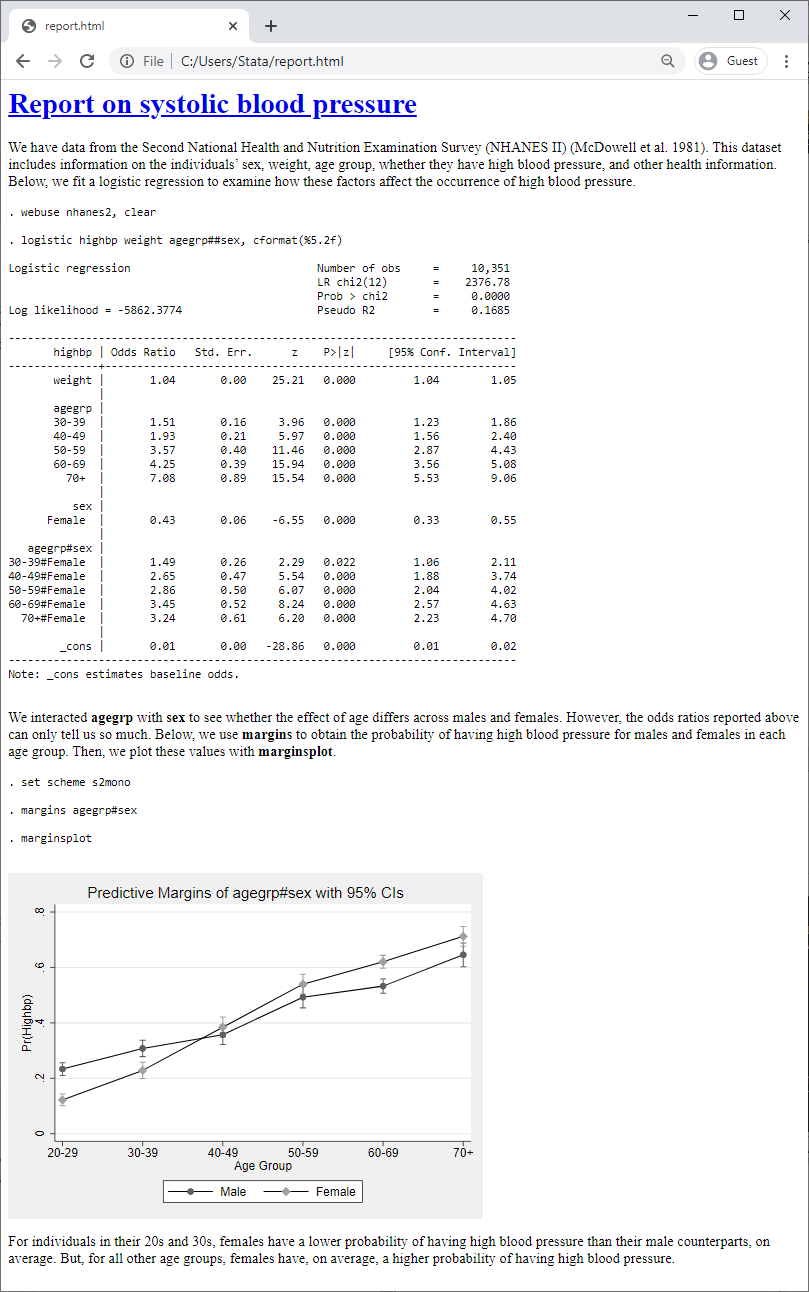
Below, I'll show you how to create this file, how effortless it is to update, and how you can automate it.
The way it works is you create a text file with all the Stata code you want to run and the accompanying text. Then you convert this text file to an HTML file with dyndoc, which will process the Markdown-formatted text and all the Stata commands, embedding them and their resulting output in the resulting file.
Creating an HTML document with Stata output
Below, we'll create the file report.txt, which will contain plain text, Markdown formatting, and Stata code. First, we specify the minimum version required to convert the .txt file. Then, we include the contents from the file header.txt. This contains some HTML code used to format the HTML document.

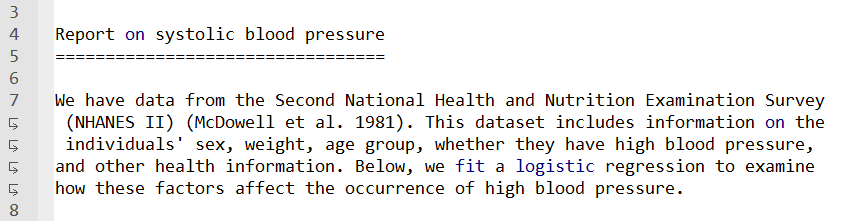
Next, we add a title to our report. One way to add a first-level header in Markdown is to underline the text with equals signs; you can also prefix the text with a hash (#). After that, we add plain text describing the data we're using and the model we fit:
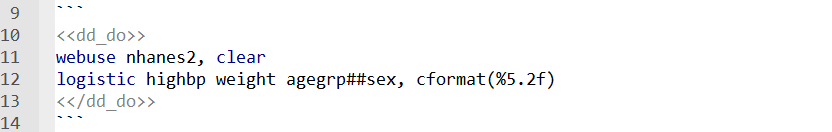
The next step is to load the data into Stata and fit our model. When writing blocks of code with Markdown, we can mark the beginning and end with either three backticks or four tildes. To process the Stata commands in the text file, we need to tell Stata that we want to do, or run, the code by using the <<dd_do>> dynamic tag. This tag will execute the code and include the output in the resulting HTML file.
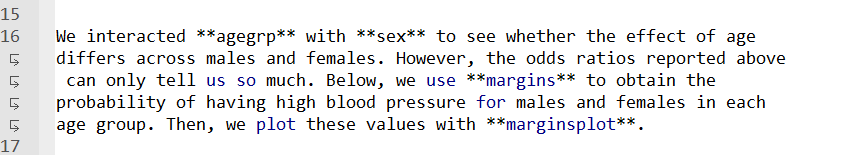
Next we discuss the interaction in our model and the motivation for the margins command. With Markdown, we can make our text bold by enclosing it between two asterisks, so we use this formatting for our variable names and Stata commands.
Examining the many lines of output from margins is not as exciting as visualizing the resulting probabilities with marginsplot, so we'll omit the output from the following commands by using the nooutput attribute. We'll also change the graphics scheme before running marginsplot.
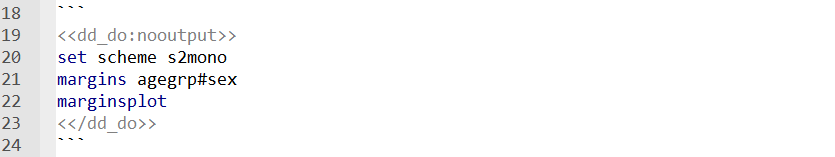
We have created the plot but have yet to actually include it in the HTML file. To insert Stata graphs, we need the <<dd_graph>> dynamic tag.
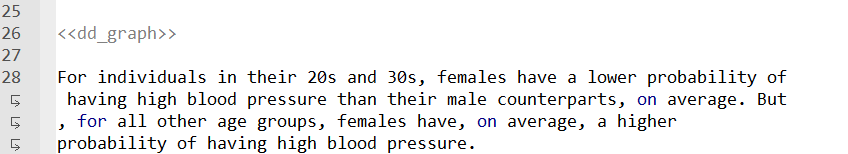
The last thing we added is a bit of text discussing the graph.
This is all we wanted to include in our HTML file, so now we use dyndoc to convert this text file to an HTML file by typing
. dyndoc report.txt
This will create the report.html file we showed above.
If you would like to try this out for yourself, you can download report.txt, header.txt, and the style sheet that header.txt calls on by typing the following in Stata:
. copy http://www.stata-press.com/data/r16/spotlight/report.txt .
. copy http://www.stata-press.com/data/r16/reporting/header.txt .
. copy http://www.stata-press.com/data/r16/reporting/stmarkdown.css .
. copy http://www.stata-press.com/data/r16/spotlight/report.html .
stmarkdown.css is a Cascading Style Sheet (CSS). If you're experienced with Markdown, you can use your preferred style sheet to format the document.
You can also download the resulting report.html and then follow along as we update our document below.
Updating your HTML document
We rarely create a final document in a single attempt. Whether you need to update your model, change the graphics scheme, or add elements to your analysis, it's easy to update your document accordingly. Simply modify your Stata code in the text file, save your modified text file, and run the dyndoc command to update the HTML file. In fact, this is why we refer to the file we have created as a dynamic document. With our narrative and statistical analysis all in one file, our document gets updated whenever our analysis does.
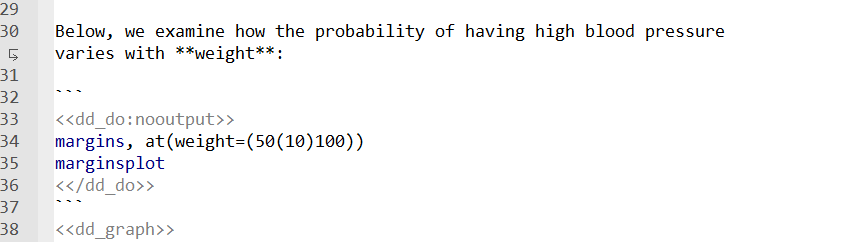
For example, let's run a margins command to see how the probability of high blood pressure varies across different values of weight. Then, we'll include the resulting graph from marginsplot in our document:
Now, we simply replace our HTML file:
. dyndoc report.txt, replace
Our updated report looks like this:
Automating your HTML document
While you can't foresee how your analysis may change, you might know in advance that your data will be changing constantly. For example, you might be working with the number of COVID-19 cases, which changes daily. Instead of modifying the text file every time, you can provide the dataset name as an argument with dyndoc. For example, we can obtain data from the COVID-19 Data Repository by the Center for Systems Science and Engineering (CSSE) at Johns Hopkins University (https://github.com/CSSEGISandData/COVID-19). The data files are named after the date. So, for example, the data for January 13, 2021, are stored in the file 01-13-2021.csv. We can import the .csv file into Stata by simply specifying the URL and the date for which we want to obtain data. We write our text file, covid.txt, as follows, using the macro `1' to refer to the date:
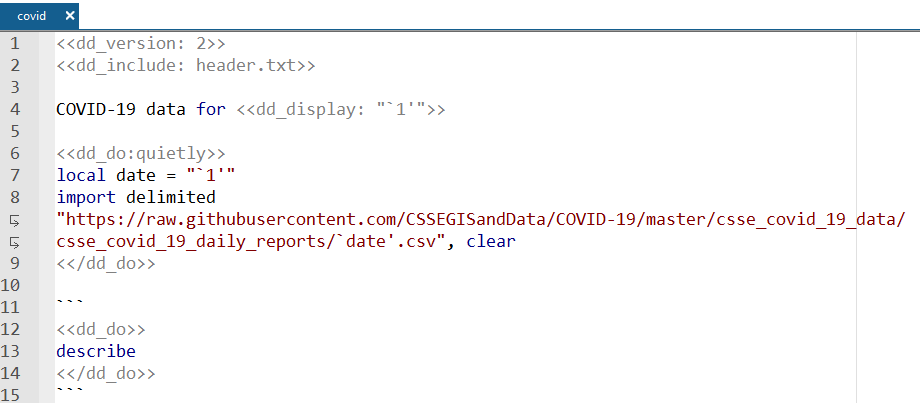
First, we state the date for which we are obtaining COVID-19 data. To expand the contents of the macro `1', we use the <<dd_display>> tag. Then, we store the date in a macro called `date'. We load the data quietly because even though the macro `date' will expand to the filename, that will not be reflected in the output from <<dd_do>>. Then, we describe our data. To create our report, we type
. dyndoc covid.txt 01-13-2021, replace
This creates the following file:
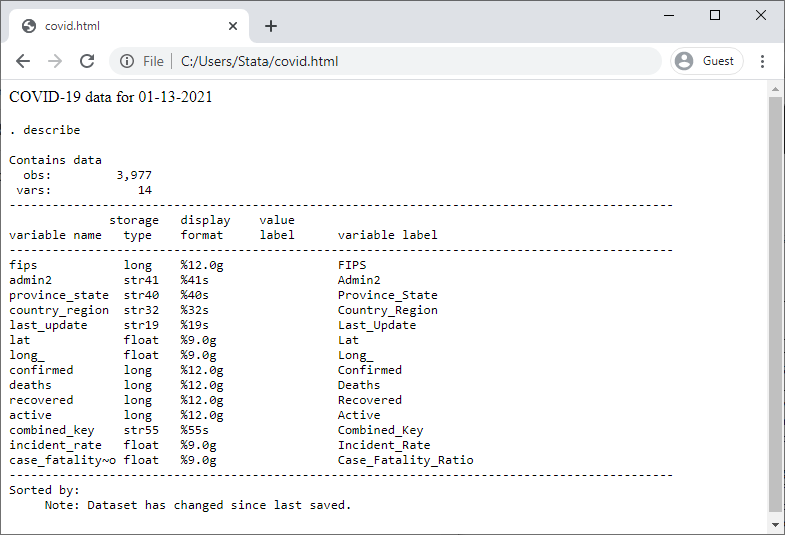
We specified only one argument, the date, so it was stored in the macro `1'. If we specified a second argument, it would be stored in the macro `2', and so on. Your variable names might also change across these different datasets, in which case you could also specify those names as arguments with dyndoc.
Because we specified the date as an argument, we do not need to modify the original text file when we are ready to perform the analysis for another day. We simply type
. dyndoc covid.txt 01-14-2021, replace
to update the file for the next day.
If you would like to create the report shown above, you can download the text file as follows:
. copy http://www.stata-press.com/data/r16/spotlight/covid.txt .
Then type the dyndoc command from above. You can specify another date as well, as long as you use the mm-dd-yyyy format. (Note that January 22, 2020 is the earliest date for which COVID-19 data are available in this repository.)
You can also download a copy of the resulting HTML file by typing the following in Stata:
. copy http://www.stata-press.com/data/r16/spotlight/covid.html .
Concluding remarks
Here I have demonstrated how you can create, modify, and automate dynamic documents. But the dyndoc command allows you to do much more than I have shown you. In addition to embedding Stata output in your HTML files, you can include the output from Stata expressions throughout your text and process text conditional on a Stata expression. You can even create dynamic documents that are compatible with Microsoft Word. Simply specify the docx option with dyndoc to create your report as a .docx file instead of an .html file. To learn more about creating dynamic documents, see [RPT] dyndoc.
Reference
- Dong, E., H. Du, and L. Gardner. 2020. An interactive web-based dashboard to track COVID-19 in real time. The Lancet Infectious Diseases 20: 533–534. https://doi.org/10.1016/S1473-3099(20)30120-1.
— Gabriela Ortiz
Applied Econometrician


