

In the spotlight: Nonparametric regression—Estimation, inference, and effects
Don't know how your outcome and covariates are related? Don't worry. You don't have to force your data into a linear model, logistic model, Poisson model, or any other model that depends on knowing something about the relationship between the outcome and covariates. You don't even need to decide whether to include squared terms or interactions among your covariates. Nonparametric regression does not depend on knowing the functional form. With Stata 15's new npregress command, you can use nonparametric kernel estimation to fit your model by simply typing
. npregress kernel y x1 x2
But you will not want to stop with estimation. After nonparametric regression, or any regression, you will want to answer questions based on that model. margins provides those answers.
On average, what would happen if everyone enrolled in a job-training program? If no one enrolled? What is the difference between the two—the treatment effect? Does this effect differ across age levels? Type
. margins i.training
. margins r.training
What would happen if everyone's salaries increased by 10%? Type
. margins, at(generate(salary = salary*1.1))
What would we expect for a female with cholesterol level of 200 and weight of 150? What about a male with the same characteristics? Type
. margins, at(female=1 chol=200 weight=150)
. margins, at(female=0 chol=200 weight=150)
How does that expectation change as cholesterol level and weight change? What does the entire response surface look like? Type
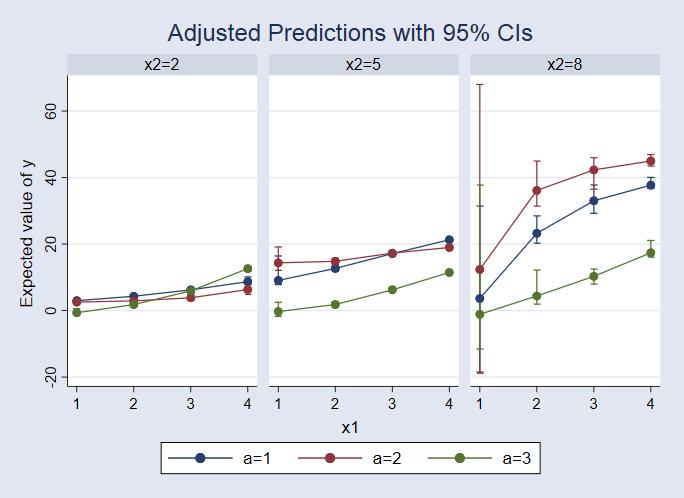
. margins i.female, at(chol = (180 200 220 240) weight=(120 150 180 210))
In our blog posts "Nonparametric regression: Like parametric regression, but not" and "Exploring the results of nonparametric regression models", we introduce nonparametric regression and illustrate how to answer many of these types of questions using margins. And we show you how to graph the results using marginsplot.
— Kristin MacDonald
Director of Statistical Services
— Enrique Pinzon
Senior Econometrician


