1 item has been added to your cart.
Importing and manipulating data
Scrape data from the web, import them from standard formats, or pull
them in via ODBC and SQL. Match-merge, append, reshape, transpose,
sort, filter. Stata handles Unicode, frames (multiple datasets in memory),
BLOBs, regular expressions, and more, whether working with hundreds of thousands
or even billions of data points.
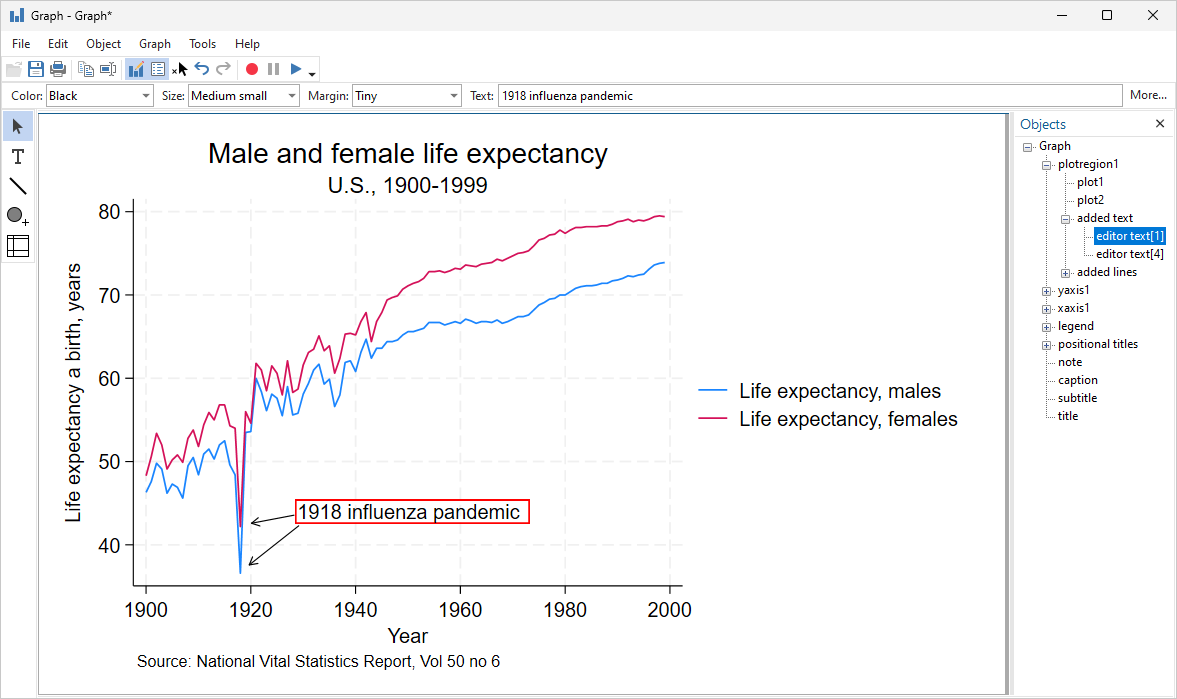
Visualization
Create graphs and customize them programmatically
or interactively with the Graph Editor. Edits
can even be recorded and "replayed" on other
graphs for reproducibility. Export to
industry standard formats suitable for web
(SVG, PNG) or print (PDF, TIFF, EPS, PS).
Automated reporting and customizable tables
Stata is designed for reproducible research, including the ability to
create dynamic documents incorporating your analysis results. Create
Word or PDF files, populate Excel worksheets with results and format
them to your liking, and mix Markdown, HTML, Stata results, and Stata
graphs, all from within Stata. Create tables that compare regression results or summary statistics, use default styles
or apply your own, and export your tables to Word, PDF, HTML, LaTeX,
Excel, or Markdown and include them in your reports.
Jupyter Notebook with Stata
Jupyter Notebook is widely used by
researchers and scientists to share their ideas and results for collaboration
and innovation. It is an easy-to-use web application that allows you to
combine code, visualizations, mathematical formulas, narrative text, and other
rich media in a single document (a "notebook") for interactive computing and
developing. You can invoke Stata and Mata from Jupyter Notebook with the
IPython (interactive Python) kernel. This
means you can combine the capabilities of both Python and Stata in a single
environment to make your work easily reproducible and shareable with others.
Linear, binary, and count regressions
Fit classical linear regression models of the relationship between a
continuous outcome, such as college algebra grade, and the determinants of
the grade, such as SAT math score and high school GPA. If your response is
binary (for example, completed degree or not), ordinal (education level),
count (number of students), or categorical (business, engineering,
liberal arts, or education major), don't worry. Stata has maximum likelihood
estimators—logistic, ordered logistic, Poisson, multinomial logit, and many
others—that estimate the relationship between such outcomes and their
determinants. A vast array of tools is available after fitting such models.
Predict outcomes and their confidence intervals. Test equality of
parameters. Compute linear and nonlinear combinations of parameters.
Multilevel mixed-effects models
Whether the groupings in your data arise in a nested fashion (students
nested in colleges and colleges nested in universities) or in a nonnested
fashion (colleges crossed with student's home state), you can fit a
multilevel model to account for the lack of independence within these
groups.
Fit models for continuous, binary, count, ordinal, and survival
outcomes. Estimate variances of random intercepts and random coefficients.
Compute intraclass correlations. Predict random effects. Estimate
relationships that are population averaged over the random effects.
Panel data
Take full advantage of the extra information that panel data provide while
simultaneously handling the peculiarities of panel data. Study the
time-invariant features within each panel, the relationships across panels,
and how outcomes of interest change over time. Fit linear models or
nonlinear models for binary, count, ordinal, censored, or survival outcomes
with fixed-effects, random-effects, or population-averaged estimators. Fit
dynamic models or models with endogeneity. Fit Bayesian panel-data models.
Structural equation modeling (SEM)
Estimate mediation effects, analyze the relationship between an unobserved
latent concept such as a quantitative reasoning and the observed variables
that measure quantitative reasoning, or fit a model with complex
relationships among both latent and observed variables.
Fit models with continuous, binary, count, and ordinal outcomes. Even fit hierarchical
models with groups of correlated observations such as students within the
same college. Evaluate model fit. Compute indirect and total effects. Fit
models by drawing a path diagram or using the straightforward command
syntax.
Meta-analysis
Combine results of multiple studies to estimate an overall effect. Use
forest plots to visualize results. Use subgroup analysis and
meta-regression to explore study heterogeneity. Use funnel plots and
formal tests to explore publication bias and small-study effects. Use
trim-and-fill analysis to assess the impact of publication bias on
results. Perform cumulative and leave-one-out meta-analysis. Perform
univariate, multilevel, and multivariate meta-analysis. Use the meta suite, or let the Control Panel interface
guide you through your entire meta-analysis.
Causal inference
Estimate experimental-style causal effects from observational data. With
Stata's treatment-effects estimators, you can use a potential-outcomes
(counterfactuals) framework to estimate, for instance, the effect of
family structure on child development or the effect of unemployment on
anxiety. Fit models for continuous, binary, count, fractional, and
survival outcomes with binary or multivalued treatments using
inverse-probability weighting (IPW), propensity-score matching,
nearest-neighbor matching, regression adjustment, or doubly robust
estimators. If the assignment to a treatment is not independent of the
outcome, you can use an endogenous treatment-effects estimator. In the
presence of group and time effects, you can use
difference-in-differences (DID) and triple-differences (DDD) estimators.
In the presence of high-dimensional covariates, you can use lasso. If
causal effects are mediated through another variable, use causal
mediation with mediate to
disentangle direct and indirect effects.
Choice models
Model your discrete choice data. If your outcome is, for instance,
high-school graduates' choices to attend college, attend a trade
school, or to work, you can fit a conditional logit, multinomial
probit, or mixed logit model. Is your outcome instead a ranking of
prefered alternatives?
Fit a rank-ordered probit or rank-ordered
logit model. Regardless of the model fit, you can use the
margins to easily interpret the results. Estimate how much
distance to the nearest college affects the probability of
enrolling in college and even the probability of going to
a trade school.
Survival analysis
Analyze duration outcomes—outcomes measuring the time to an event
such as failure or death—using Stata's specialized tools for
survival analysis. Account for the complications inherent in survival
data, such as sometimes not observing the event (right-, left-, and
interval-censoring), individuals entering the study at differing times
(delayed entry), and individuals who are not continuously observed
throughout the study (gaps). You can estimate and plot the probability
of survival over time. Or model survival as a function of covariates
using Cox, Weibull, lognormal, and other regression models. Predict
hazard ratios, mean survival time, and survival probabilities. Do you
have groups of individuals in your study? Adjust for within-group
correlation with a random-effects or shared-frailty model. If you have
many potential covariates, use lasso
cox and elasticnet cox for
model selection and prediction.
Multivariate methods
Use multivariate analyses to evaluate relationships among variables from
many different perspectives. Perform multivariate tests of means, or fit
multivariate regression and MANOVA models.
Explore relationships between two
sets of variables, such as aptitude measurements and achievement
measurements using canonical correlation. Examine the number and structure
of latent concepts underlying a set of variables using exploratory factor
analysis. Or use principal component analysis to find underlying structure
or to reduce the number of variables used in a subsequent analysis. Discover
groupings of observations in your data using cluster analysis. If you have
known groups in your data, describe differences between them using
discriminant analysis.
Bayesian analysis
Fit Bayesian regression models using one of the Markov chain Monte Carlo
(MCMC) methods. You can choose from various supported models or even
program your own. Extensive tools are available to check convergence,
including multiple chains. Compute posterior mean estimates and credible
intervals for model parameters and functions of model parameters. You
can perform both interval- and model-based hypothesis testing. Compare
models using Bayes factors. Compute model fit using posterior predictive
values and generate predictions. If you want to account for model
uncertainty in your regression model, use
Bayesian model averaging.
Intuitive and easy to use.
Once you learn the syntax of one estimator, graphics command,
or data management tool, you will effortlessly understand the rest.
Accuracy and reliability.
Stata is extensively and continually tested. Stata's tests produce
approximately 5.8 million lines of output. Each of those lines is
compared against known-to-be-accurate results
across editions of Stata and every operating system Stata supports to
ensure accuracy and reproducibility.
One package. No modules.
When you buy Stata, you obtain
everything for your statistical,
graphical, and data analysis needs. You do not need to buy separate modules
or import your data to specialized software.
Write your own Stata programs.
You can easily write your own Stata programs and commands. Share them
with others or use them to simplify your work. Utilize Stata's
do-files, ado-files, and Mata: Stata's own advanced programming
language that adds direct support for matrix programming. You can also
access and benefit from the thousands of existing Stata
community-contributed programs.
Extensive documentation.
Stata offers 35 manuals with more than 18,000 pages of PDF documentation
containing detailed examples, in-depth discussions, references to relevant literature,
and methods and formulas. Stata's documentation is a great place to learn about
Stata and the statistics, graphics, data management, and data science tools you
are using for your research.
Top-notch technical support.
Stata's technical support is known for their prompt, accurate,
detailed, and clear responses. People answering your questions have master's
and PhD degrees in relevant areas of research.
Join us for one of our free live webinars. Ready. Set. Go Stata shows you how to quickly get started manipulating, graphing, and analyzing your data. Or, go deeper in one of our special-topics webinars.
Stata's YouTube has over 300 videos with playlists for a variety of methodologies important to institutional researchers. And they are a convenient teaching aid in the classroom.
Get started quickly at using Stata effectively, or even learn how to perform rigorous time-series, panel-data, or survival analysis, all from the comfort of you home or office. NetCourses make it easy.
Stata Press offers books with clear, step-by-step examples that make teaching easier and that enable students to learn and institutional researchers to implement the latest best practices in analysis.