
1 item has been added to your cart.
| Title | Analysis of multiple failure-time survival data | |
| Authors |
Mario Cleves, StataCorp |
This FAQ first appeared as an article in STB-49, ssa13, under the heading Analysis of multiple failure-time data with Stata. Minor revisions have subsequently been made. In this article, when a subject experiences one of the events, it still remains at risk for events of different types. In section 3.1.2 of this FAQ, we show a method to fit a Cox model to a dataset with unordered failure events of different types. The examples described in this section are not exactly the same as what we call “competing risk” in the [ST] Stata Survival Analysis Reference Manual. In the Stata documentation, we follow the definition for competing risk used in Fine and Gray (1999), where the competing event impedes the occurrence of the event of interest. If you have competing-risk data in the sense of Fine and Gray, see the entry for stcrreg in the [ST] Stata Survival Analysis Reference Manual.
Multiple failure-time data or multivariate survival data are frequently encountered in biomedical and other investigations. These data arise from time-to-occurrence studies when either of two or more events (failures) occur for the same subject, or from identical events occurring to related subjects such as family members or classmates. In these studies, failure times are correlated within cluster (subject or group), violating the independence of failure times assumption required in traditional survival analysis.
In this paper, we follow Therneau’s (1997) suggestion that for analyses purposes, failure events should be classified according to (1) whether they have a natural order, and (2) whether they are recurrences of the same types of events. Failures of the same type include, for example, repeated lung infections with pseudomonas in children with cystic fibrosis, or the development of breast cancer in genetically predisposed families. Failures of different types include adverse reactions to therapy in cancer patients on a particular treatment protocol, or the development of connective tissue disease symptoms in a group of third graders exposed to hazardous waste.
Ordered events may result from a study that records the time to first myocardial infarction (MI), second MI, and so on. These are ordered events in the sense that the second event cannot occur before the first event. Unordered events, on the other hand, can occur in any sequence. For example, in a study of liver disease patients, a panel of seven liver function laboratory tests can become abnormal in a specific order for one patient and in a different order for another patient. The order in which the tests become abnormal (fail) is random.
The simplest way of analyzing multiple failure data is to examine time to first event, ignoring additional failures. This approach, however, is usually not adequate because it wastes possibly relevant information. Alternative methods have been developed that make use of all available data while accounting for the lack of independence of the failure times. Two approaches to modeling these data have gained popularity over the last few years.
One way to account for within-group dependency is to include a random-effect term to model unobserved effects shared by all members of the cluster. These random effects can be included multiplicatively in the hazard function as a shared frailty, which can be easily accomplished with the options frailty and shared to streg and stcox. Alternatively, random effects can be included additively in the linear form in a parametric model by using mestreg. In addition, mestreg allows you to account for several levels of clustering, and even to include random coefficients. The frailty/random-effects approach won't be discussed further in this article; you can read more about those models in the [ST] Stata Survival Analysis Reference Manual.
In this article, the dependencies between failure times are not included in the models. Instead, the covariance matrix of the estimators is adjusted to account for the additional correlation. These models,which we will call “variance-corrected” models, also easily estimated in Stata. In this paper we illustrate the principal ideas and procedures for estimating these models using the Cox proportional hazard model. There is no theoretical reason, however, why other hazard functions could not be used.
Let Xki and Cki be the failure and
censoring time of the kth failure type (k = 1, ...,
K) in the ith cluster (i = 1, ..., m), and let
Zki be a p-vector of possibly time-dependent
covariates, for ith cluster with respect to the
kth failure type. "Failure type" is used here to mean both
failures of different types and failures of the same type. Assume that
Xkiand Cki are independent, conditional
on the covariate vector (Zki). Define
Tki = min(Xki; Cki)
and
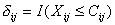 where I(.) is the indicator function, and let
 be a p-vector of unknown regression coefficients. Under the
proportional hazard assumption, the hazard function of the
ith cluster for the kth failure type is
be a p-vector of unknown regression coefficients. Under the
proportional hazard assumption, the hazard function of the
ith cluster for the kth failure type is
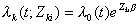
if the baseline hazard function is assumed to be equal for every failure type, or
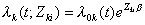
if the baseline hazard function is allowed to differ by failure type (Lin 1994).
Maximum likelihood estimates of
for the above models are obtained from the Cox’s partial
likelihood function,
L(),
assuming independence of failure times. The estimator
 has been shown to be a consistent estimator for
and is asymptotically normal as long as the marginal models
are correctly specified (Lin 1994). The resulting estimated covariance matrix
obtained as the inverse of the information matrix, however,
has been shown to be a consistent estimator for
and is asymptotically normal as long as the marginal models
are correctly specified (Lin 1994). The resulting estimated covariance matrix
obtained as the inverse of the information matrix, however,
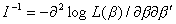
does not take into account the additional correlation in the data, and therefore, it is not appropriate for testing or constructing confidence intervals for multiple failure time data.
Lin and Wei (1989) proposed a modification to this estimate, appropriate when the Cox model is misspecified. The resulting robust variance–covariance matrix is estimated as

where U is a n x p matrix of efficient score residuals. The above formula assumes that the n observations are independent. When observations are not independent, but can be divided into m independent groups (G1, G2, ..., Gm), then the robust covariance matrix takes the form

where G is a m x p matrix of the group efficient score residuals. In terms of Stata, V is calculated according to the first formula when the vce(robust) option is specified and according to the second formula when vce(cluster id) is specified.
All variance-adjusted models suggested to date can be estimated in Stata. All that is required is some preliminary thought about the analytic model required, the correct way to set up the data, and the command options to be specified.
The examples in this section are presented under the following headings:
The steps for analyzing multiple failure data in Stata are (1) decide whether the failure events are ordered or unordered, (2) select the proper statistical model for the data, (3) organize the data according to the model selected, and (4) use the proper commands and command options to stset the data and fit the model. Much of this paper deals with the appropriate method for setting the data and the correct way of specifying the estimation command. The examples are used solely to illustrate these processes. Consult the references for more detailed discussions on these methods and the datasets used.
The data setup for the analysis of unordered events is relatively simple. One first decides if the failure events are of the same type or of different type, or equivalently, whether the baseline hazard should be equal for all event types or should be all owed to vary by event type. Failure events of the same type are described in section 3.1.1. In section 3.1.2, the baseline hazard is allowed to vary by failure type and is used to examine a dataset with unordered failure events of different types.
A possible source of correlated failure times of the same event type are familial studies, in which each family member is at risk of developing a disease of interest. Failure times of family members are correlated because they share genetic and perhaps environmental factors.
Another source of correlated failure times of the same type are studies where the same event can occur on the same individual multiple times. This is rare because we are also restricting the events to have no order. Lee, Wei, and Amato (1992) analyzed data from the National Eye Institute study on the efficacy of photocoagulation as a treatment for diabetic retinopathy. In that study, each subject was treated with photocoagulation on one randomly selected eye while the other eye served as an untreated matched control. The outcome of interest was the onset of severe visual loss, and the study hoped to show that laser photocoagulation significantly reduced the time to onset of blindness. In this study, the sampling units, the eyes, are pairwise correlated , the failure types are the same and unordered because the right eye can fail before the left eye or vice versa.
These types of data are straightforward to setup and analyze in Stata. Each sampling unit is entered once into the dataset. In the family data, each family member appears as an observation in the dataset and an id variable identifies his or her family. In the laser photocoagulation example, because each eye is a sampling unit, each eye appears as an observation in the dataset. Therefore, if there are n patients in the diabetic retinopathy study then the resulting dataset would contain 2n observations. A variable is used to identify the matched eyes.
We will illustrate using a subset of the diabetic retinopathy data. The data from 197 high-risk patients was entered into a Stata dataset. The first four observations are
. list in 1/4, noobs
| id time cens agegrp treat |
| 5 46.23 0 1 1 |
| 5 46.23 0 1 0 |
| 14 42.5 0 0 1 |
| 14 31.3 1 0 0 |
Each patient has two observations in the dataset, one for the treated eye (treat=1) and another for the "control" eye, treat=0. The data, therefore, contain 394 observations. Each eye is assumed to enter the study at time 0 and it is followed until blindness develops or censoring occurs. The follow-up time is given by the variable time. The four observations listed above correspond to patients with id=5 and id=14.
After creating the dataset, it is then stset as usual. The id() option, however, is not specified. Specifying id() would cause stset to interpret subjects with the same id() as the same sampling unit and would drop them because of overlapping study times. Thus, we type
. stset time, failure(cens)
| failure event: cens != 0 & cens != . obs. time interval: (0, time] exit on or before: failure | ||
| 394 total obs. 0 exclusions | ||
| 394 obs. remaining, representing 155 failures in single record/single failure data 14018.24 total analysis time at risk, at risk from t = 0 earliest observed entry t = 0 last observed exit t = 74.97 | ||
Note that stset correctly reports that there are 394 observations. The command for fitting the corresponding Cox model is
. stcox agegrp treat, vce(cluster id) efron nohr

 Iteration 0:   log likelihood = -867.98581
 Iteration 1:   log likelihood = -856.74901
 Iteration 2:   log likelihood = -856.74456
 Refining estimates:
 Iteration 0:   log likelihood = -856.74456

 Cox regression -- Efron method for ties

 No. of subjects =          394                     Number of obs   =       394
 No. of failures =          155
 Time at risk    =  14018.24001
                                                    Wald chi2(2)    =     27.71
 Log likelihood  =   -856.74456                     Prob > chi2     =    0.0000

                                (standard errors adjusted for clustering on id)
| _t | Robust | |
| _d | Coefficient Std. err. z P>|z| [95% conf. interval] | |
| agegrp | .0538829 .1790951 0.301 0.764 -.2971371 .4049028 | |
| treat | -.7789297 .1488857 -5.232 0.000 -1.07074 -.487119 | |
The vce(cluster id) option specifies to stcox which observations are related. Stata knows to produce robust standard errors whenever the vce(cluster clustvar) option is used. The efron option requests that Efron’s method for handling ties be used, and the nohr option is used to request that coefficients, instead of hazard ratios, be reported.
A common data source of unordered failure events of different types are studies where a patient can suffer several outcomes of interest in random order. In the analysis of these data, the baseline hazard function is allowed to vary by failure type. This is accomplished by stratifying the data on failure type, allowing each stratum to have its own baseline hazard function, but restricting the coefficients to be the same across strata.
We illustrate the use of Stata in the analysis of this kind of model, with a subset of the Mayo Clinic’s Ursodeoxycholic acid (UDCA) data (Lindor et al. 1994). The dataset consists of 170 patients with primary biliary cirrhosis randomly allocated to either the UDCA treatment group or a group receiving a placebo. The times up to nine possible events were recorded: death, liver transplant, voluntary withdraw, histologic progression, development of varices, development of ascites, development of encephalophathy, doubling of bilirubin, and worsening of symptoms. All times were measured from the date of treatment allocation.
An important characteristic of these failure events is that each can occur only once per subject. Note that all subjects are at risk for all events. Also, when a subject experiences one of the events, he remains at risk for all other events. Therefore, if there are k possible events, each subject will appear k times in the dataset, once for each possible failure. Here is the resulting data for two of the subjects.
. list id rx bili time status rec if id==5 |
> id==18, nod noobs
| id rx bili time status rec |
| 5 placebo .0953102 1875 0 1 |
| 5 placebo .0953102 1875 0 2 |
| 5 placebo .0953102 1875 0 3 |
| 5 placebo .0953102 1875 0 4 |
| 5 placebo .0953102 1875 0 5 |
| 5 placebo .0953102 1875 0 6 |
| 5 placebo .0953102 1875 0 7 |
| 5 placebo .0953102 1875 0 8 |
| 5 placebo .0953102 1875 0 9 |
| 18 placebo .1823216 391 1 9 |
| 18 placebo .1823216 391 1 8 |
| 18 placebo .1823216 763 1 5 |
| 18 placebo .1823216 765 0 2 |
| 18 placebo .1823216 765 0 1 |
| 18 placebo .1823216 765 0 6 |
| 18 placebo .1823216 765 0 7 |
| 18 placebo .1823216 765 1 3 |
| 18 placebo .1823216 765 0 4 |
Each patient appears nine times, once for each possible event. The event type, rec, is coded as 1 through 9. Patient number 5 did not experience any events during the 1,875 days of follow-up. Thus, he appears censored nine times in the data, each observation recording the complete follow-up period. Patient 18 experienced 4 events: rec=8 (doubling of bilirubin), rec=9 (worsening of symptoms), rec=5 (development of varices) and rec=3 (voluntary withdraw).
The command to stset the data is used without specifying the id() option.
. stset time, failure(status)
| failure event: status != 0 & status != . obs. time interval: (0, time] exit on or before: failure | ||
| 1530 total obs. 0 exclusions | ||
| 1530 obs. remaining, representing 145 failures in single record/single failure data 1808720 total analysis time at risk, at risk from t = 0 earliest observed entry t = 0 last observed exit t = 1896 | ||
It correctly reported 1,530 observations (170x9). The id variable will be used to cluster the related observations when estimating the Cox model. Additionally, it does not seem reasonable to assume that each failure type should have the same baseline hazard, thus the Cox model will be stratified by failure type.
. stcox rx bili hi_stage, nohr efron strata(rec) vce(cluster id) nolog

 Stratified Cox regr. — Efron method for ties

 No. of subjects =         1530                     Number of obs   =      1530
 No. of failures =          145
 Time at risk    =      1808720
                                                    Wald chi2(3)    =     31.99
 Log likelihood  =   -662.44704                     Prob > chi2     =    0.0000

                                dard errors adjusted for clustering on id)
| _t | Robust | |
| _d | Coefficient Std. err. z P>|z| [95% conf. interval] | |
| rx | -.9371209 .240996 -3.889 0.000 -1.409464 -.4647774 | |
| bili | .5859002 .1491832 3.927 0.000 .2935065 .8782939 | |
| hi_stage | -.0754988 .2777845 -0.272 0.786 -.6199464 .4689488 | |
The covariates are treatment group (rx), log(bilirubin) (bili), and high histologic stage indicator (hi_stage).
There are several approaches to the analysis of ordered events. The principal difference between these methods is in the way that the risk sets are defined at each failure time. The simplest method to implement in Stata follows the counting process approach of Andersen and Gill (1982). The basic assumption is that all failure types are equal or indistinguishable. The problem then reduces to the analysis of time to first event, time to second event, and so on. Thus, the risk set at time t for event k is all subjects under observation at time t. A major limitation of this approach is that it does not allow more than one event to occur at a given time. For example, in a study examining time to side effects of a new medication, if a patient exhibits two side effects at the same time, the corresponding observations are dropped because the time span between failures is zero. This approach is illustrated in section 3.2.1.
A second model, proposed by Wei, Lin, and Weissfeld (1989), is based on the idea of marginal risk sets. For this analysis, the data is treated as if the failure events were unordered, so each event has its own stratum and each patient appears in all strata. The marginal risk set at time t for event k is made up of all subjects under observation at time t that have not had event k. This approach is illustrated in section 3.2.2.
A third method proposed by Prentice, Williams, and Peterson (1981) is known as the conditional risk set model. The data are set up as for Andersen and Gill’s counting processes method, except that the analysis is stratified by failure order. The assumption made is that a subject is not at risk of a second event until the first event has occurred and so on. Thus, the conditional risk set at time t for event k is made up of all subjects under observation at time t that have had event k − 1. There are two variations to this approach. In the first variation, time to each event is measured from entry time, and in the second variation, time to each event is measured from the previous event. This approach is illustrated in sections 3.2.3 and 3.2.4.
The above three approaches will be illustrated using the bladder cancer data presented by Wei, Lin, and Weissfeld (1989). These data were collected from a study of 85 subjects randomly assigned to either a treatment group receiving the drug thiotepa or to a group receiving a placebo control. For each patient, time for up to four tumor recurrences was recorded in months (r1–r4). These are the first nine observations in the data.
. list in 1/9, noobs
| id group futime number size r1 r2 r3 r4 |
| 1 placebo 1 1 3 0 0 0 0 |
| 2 placebo 4 2 1 0 0 0 0 |
| 3 placebo 7 1 1 0 0 0 0 |
| 4 placebo 10 5 1 0 0 0 0 |
| 5 placebo 10 4 1 6 0 0 0 |
| 6 placebo 14 1 1 0 0 0 0 |
| 7 placebo 18 1 1 0 0 0 0 |
| 8 placebo 18 1 3 5 0 0 0 |
| 9 placebo 18 1 1 12 16 0 0 |
The id variable identifies the patients, group is the treatment group, futime is the total follow-up time for the patient, number is the number of initial tumors, size is the initial tumor size, and r1 to r4 are the times to first, second, third, and fourth recurrence of tumors. A recurrence time of zero indicates no tumor.
To implement the Andersen and Gill model using the results from the bladder cancer study, the data are set up as follows: for each patient there must be one observation per event or time interval. For example, if a subject has one event, then there will be two observations for that subject. The first observation will cover the time span from entry into the study until the time of the event, and the second observation spans the time from the event to the end of follow-up. The data for the nine subjects listed above is
. list if id!=10, noobs
| id group time0 time status number size |
| 1 placebo 0 1 0 1 3 |
| 2 placebo 0 4 0 2 0 |
| 3 placebo 0 7 0 1 0 |
| 4 placebo 0 10 0 5 0 |
| 5 placebo 0 6 1 4 0 |
| 5 placebo 6 10 0 4 0 |
| 6 placebo 0 14 0 1 0 |
| 7 placebo 0 18 0 1 0 |
| 8 placebo 0 5 1 1 3 |
| 8 placebo 5 18 0 1 3 |
| 9 placebo 0 12 1 1 1 |
| 9 placebo 12 16 1 1 1 |
| 9 placebo 16 18 0 1 1 |
In the original data, subjects 1 through 4 had no tumors recur, thus, each of these 4 patients has only one censored (status=0) observation spanning from time0=0 to end of follow-up (time=futime}). Patient 5 ( id=5) had one tumor recur at 6 months and was followed until month 10. This patient has two observations in the final dataset; one from time0=0 to tumor recurrence (time=6), ending in an event (status=1), and another from time0=6 to end of follow-up (time=10), ending as censored (status =0).
We stset the data with the command
. stset time, fail(status) exit(time .) id(id) enter(time0)
| id: id failure event: status != 0 & status != . obs. time interval: (time[_n-1], time] enter on or after: time time0 exit on or before: time time | ||
| 178 total obs. 0 exclusions | ||
| 178 obs. remaining, representing 85 subjects 112 failures in multiple failure-per-subject data 2480 total analysis time at risk, at risk from t = 0 earliest observed entry t = 0 last observed exit t = 59 | ||
and we fit the Andersen–Gill Cox model as
. stcox group size number, nohr efron vce(robust) nolog

Cox regression — Efron method for ties
No. of subjects =           85                     Number of obs   =       178
No. of failures =          112
Time at risk    =         2480
                                                   Wald chi2(3)    =     11.41
Log likelihood  =   -449.98064                     Prob > chi2     =    0.0097
                               (standard errors adjusted for clustering on id)
| _t | Robust | |
| _d | Coefficient Std. err. z P>|z| [95% conf. interval] | |
| group | -.464687 .2671369 -1.740 0.082 -.9882656 .0588917 | |
| size | -.0436603 .0780767 -0.559 0.576 -.1966879 .1093673 | |
| number | .1749604 .0634147 2.759 0.006 .0506699 .2992509 | |
This time it was not necessary to specify the vce(cluster id) option. Because stset’s id() option was used, Stata knows to cluster on the id() variable when producing robust standard errors.
The setup for the marginal risk model is identical to the model described in section 3.1.2. In essence the model ignores the ordering of events and treats each failure occurrence as belonging in an independent stratum.
The resulting data for the first six of the nine subjects listed above are
. list id group time status number size rec if id<7, noobs
| id group time status number size rec |
| 1 placebo 1 0 1 3 1 |
| 1 placebo 1 0 1 3 2 |
| 1 placebo 1 0 1 3 3 |
| 1 placebo 1 0 1 3 4 |
| 2 placebo 4 0 2 1 1 |
| 2 placebo 4 0 2 1 2 |
| 2 placebo 4 0 2 1 3 |
| 2 placebo 4 0 2 1 4 |
| 3 placebo 7 0 1 1 1 |
| 3 placebo 7 0 1 1 2 |
| 3 placebo 7 0 1 1 3 |
| 3 placebo 7 0 1 1 4 |
| 4 placebo 10 0 5 1 1 |
| 4 placebo 10 0 5 1 2 |
| 4 placebo 10 0 5 1 3 |
| 4 placebo 10 0 5 1 4 |
| 5 placebo 6 1 4 1 1 |
| 5 placebo 10 0 4 1 2 |
| 5 placebo 10 0 4 1 3 |
| 5 placebo 10 0 4 1 4 |
| 6 placebo 14 0 1 1 1 |
| 6 placebo 14 0 1 1 2 |
| 6 placebo 14 0 1 1 3 |
| 6 placebo 14 0 1 1 4 |
The data are then stset without specifying the id() option:
. stset time, failure(status)
| failure event: status != 0 & status != . obs. time interval: (0, time] exit on or before: failure | ||
| 340 total obs. 0 exclusions | ||
| 340 obs. remaining, representing 112 failures in single record/single failure data 8522 total analysis time at risk, at risk from t = 0 earliest observed entry t = 0 last observed exit t = 59 | ||
and the Cox model is fitted by clustering on id and stratifying on the failure occurrence variable (rec).
. stcox group size number, nohr efron strata(rec) vce(cluster id) nolog

 Stratified Cox regr. — Efron method for ties
 No. of subjects = 340                              Number of obs   =      340
 No. of failures = 112
 Time at risk    = 8522
                                                    Wald chi2(3)    =    15.35
 Log likelihood = -426.14683                        Prob > chi2     =   0.0015

                               (standard errors adjusted for clustering on id)
| _t | Robust | |
| _d | Coefficient Std. err. z P>|z| [95% conf. interval] | |
| group | -.5847935 .3097738 -1.888 0.059 -1.191939 .0223521 | |
| size | -.051617 .095148 -0.542 0.587 -.2381036 .1348697 | |
| number | .2102937 .0670372 3.137 0.002 .0789032 .3416842 | |
As previously mentioned, there are two variations of the conditional risk set model. The first variation in which time to each event is measured from entry is illustrated in this section.
The data are set up as for Andersen and Gill’s method, however, a variable indicating the failure order is included. The resulting observations for the first nine subjects are
. list id if id<10, noobs
| id group time0 time status number size str |
| 1 placebo 0 1 0 1 3 1 |
| 2 placebo 0 4 0 2 1 1 |
| 3 placebo 0 7 0 1 1 1 |
| 4 placebo 0 10 0 5 1 1 |
| 5 placebo 0 6 1 4 1 1 |
| 5 placebo 6 10 0 4 1 2 |
| 6 placebo 0 14 0 1 1 1 |
| 7 placebo 0 18 0 1 1 1 |
| 8 placebo 0 5 1 1 3 1 |
| 8 placebo 5 18 0 1 3 2 |
| 9 placebo 0 12 1 1 1 1 |
| 9 placebo 12 16 1 1 1 2 |
| 9 placebo 16 18 0 1 1 3 |
The resulting dataset is identical to that used to fit Andersen and Gill’s model except that the str variable identifies the failure risk group for each time span. For the first 4 individuals, who have not had a tumor recur, the str value is one, meaning that during their total observed time they are at risk of first failure. The last individual listed, id=9, was at risk of a first recurrence for 12 months (str=1), at risk of a second recurrence from 12 through 16 months (str=2), and at risk of a third recurrence from 16 months to the end of follow-up (str=3).
The stset command is identical to that used for the Andersen and Gill model.
. stset time, fail(status) exit(time .) id(id) enter(time0)
| id: id failure event: status != 0 > status != . obs. time interval: (time[_n-1], time] enter on or after: time time0 exit on or before: time time | ||
| 178 total obs. 0 exclusions | ||
| 178 obs. remaining, representing 85 subjects 112 failures in multiple failure-per-subject data 2480 total analysis time at risk, at risk from t = 0 earliest observed entry t = 0 last observed exit t = 59 | ||
The corresponding conditional risk model is
. stcox group size number, nohr efron vce(robust) nolog strata(str)

 Stratified Cox regr. — Efron method for ties

 No. of subjects =           85                     Number of obs   =       178
 No. of failures =          112
 Time at risk    =         2480
                                                    Wald chi2(3)    =      7.17
 Log likelihood  =   -315.99082                     Prob > chi2     =    0.0665

                                (standard errors adjusted for clustering on id)
| _t | Robust | |
| _d | Coefficient Std. err. z P>|z| [95% conf. interval] | |
| group | -.3334887 .2060021 -1.619 0.105 -.7372455 .070268 | |
| size | -.0084947 .062001 -0.137 0.891 -.1300144 .1130251 | |
| number | .1196172 .0516917 2.314 0.021 .0183033 .2209311 | |
The second variation of the conditional risk set model measures time to each event from the time of the previous event. The data is set up as in 3.2.3, except that time is not measured continuously from study entry, but the clock is set to zero after each failure.
. list id if id!=10, noobs nod
| id group time0 time status number size str | |
| 1. | 1 placebo 0 1 0 1 3 1 |
| 2. | 2 placebo 0 4 0 2 1 1 |
| 3. | 3 placebo 0 7 0 1 1 1 |
| 4. | 4 placebo 0 10 0 5 1 1 |
| 5. | 5 placebo 0 4 0 4 1 2 |
| 6. | 5 placebo 0 6 1 4 1 1 |
| 7. | 6 placebo 0 14 0 1 1 1 |
| 8. | 7 placebo 0 18 0 1 1 1 |
| 9. | 8 placebo 0 5 1 1 3 1 |
| 10. | 8 placebo 0 13 0 1 3 2 |
| 11. | 9 placebo 0 2 0 1 1 3 |
| 12. | 9 placebo 0 4 1 1 1 2 |
| 13. | 9 placebo 0 12 1 1 1 1 |
Note that the initial times for all time spans are set to zero and that the time variable now reflects the length of the time span. After creating the new time variable, the data need to be stset again.
. stset time, fail(status) exit(time .) enter(time0)
| failure event: status != 0 & status != . obs. time interval: (0, time] enter on or after: time time0 exit on or before: time time | ||
| 178 total obs. 0 exclusions | ||
| 178 obs. remaining, representing 112 failures in single record/single failure data 2480 total analysis time at risk, at risk from t = 0 earliest observed entry t = 0 last observed exit t = 59 | ||
The corresponding conditional risk model is
. stcox group size number, nohr efron vce(robust) nolog strata(str)
> cluster(id)

 Stratified Cox regr. — Efron method for ties

 No. of subjects =          178                     Number of obs   =       178
 No. of failures =          112
 Time at risk    =         2480
                                                    Wald chi2(3)    =     11.70
 Log likelihood  =   -358.96849                     Prob > chi2     =    0.0085

                                (standard errors adjusted for clustering on id)
| _t | Robust | |
| _d | Coefficient Std. err. z P>|z| [95% conf. interval] | |
| group | -.2790045 .2169035 -1.286 0.198 -.7041277 .1461186 | |
| size | .0074151 .0647143 0.115 0.909 -.1194226 .1342528 | |
| number | .1580459 .0512421 3.084 0.002 .0576133 .2584785 | |
This paper details how Stata can be used to fit variance-corrected models for the analysis of multiple failure-time data. The examples used to illustrate the various approaches, although real, were simple. More complicated datasets, however, containing time-dependent covariates, varying time scales, delayed entry and other complications, can be set up and analyzed following the guidelines illustrated in this paper.
The most important aspect in the implementation of the methods described is the accurate construction of the dataset for analysis. Care must be taken to correctly code entry and exit times, strata variables and failure/censoring indicators. It is strongly recommended that, after creating the final dataset and before analyzing and reporting results, the data be examined thoroughly. Lists of all representative, and especially complex cases, should be carefully verified. This step, although time consuming and tedious, is indispensable, especially when working with complicated survival data structures.
A second important aspect of the analysis is the proper use of the stset command. Become familiar and have a clear understanding of the id(), origin(), enter() and time0() options. Review the output from stset and confirm that the final data contain the expected number of observations and failures. Check any records dropped and verify the data, especially the stset created variables, by listing and examining observations.
Lastly fit the model using the correct stcox options to produce robust standard errors and, if needed, the strata specific baseline hazard.


