

Updates to Stata's graphic features were introduced in Stata 11.
|
| Order |
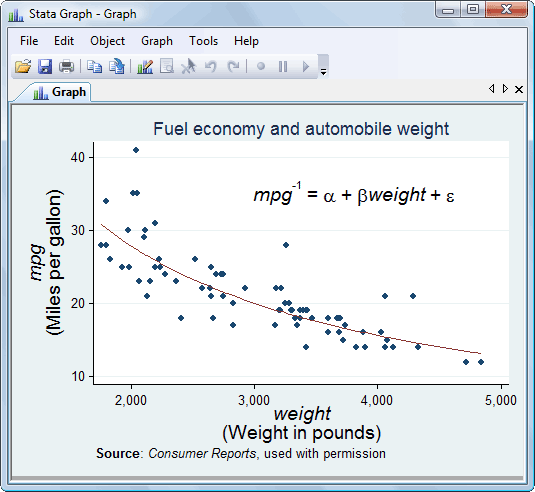
You can now include multiple fonts in regular, bold, and italics; the full Greek alphabet in upper- and lowercase; and over 70 mathematical symbols anywhere that text appears in graphs.
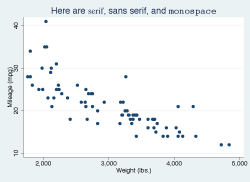
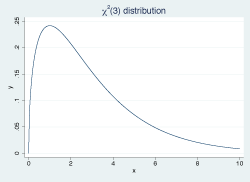
Graphs now accept an extended version of Stata’s text markup language, SMCL. Greek letters and mathematical symbols have intuitive, easy-to-remember names (tags). To make the title of the x axis of your graph say “β-carotene”, you just specify xtitle(“{&beta}-carotene”). To include χ2 in your text, specify {&chi} {superscript:2} or, even shorter, {&chi}{sup:2}. Additional tags make it easy to select from among sans serif, serif, monospace, and symbol fonts.
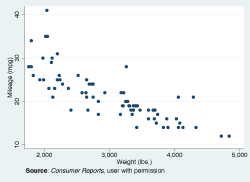
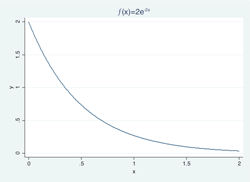
Here are a few other examples. Click on them to enlarge them.
 |
 |
 |
 |
Of course, these new features are also available via the dialog boxes and through the interactive Graph Editor.
Here is a complete list of what’s new in Stata graphics:
Learn
Free webinars
NetCourses
Classroom and web training
Organizational training
Video tutorials
Third-party courses
Web resources
Teaching with Stata
© Copyright 1996–2026 StataCorp LLC. All rights reserved.
×
We use cookies to ensure that we give you the best experience on our website—to enhance site navigation, to analyze usage, and to assist in our marketing efforts. By continuing to use our site, you consent to the storing of cookies on your device and agree to delivery of content, including web fonts and JavaScript, from third party web services.
Cookie Settings
Last updated: 16 November 2022
StataCorp LLC (StataCorp) strives to provide our users with exceptional products and services. To do so, we must collect personal information from you. This information is necessary to conduct business with our existing and potential customers. We collect and use this information only where we may legally do so. This policy explains what personal information we collect, how we use it, and what rights you have to that information.
These cookies are essential for our website to function and do not store any personally identifiable information. These cookies cannot be disabled.
This website uses cookies to provide you with a better user experience. A cookie is a small piece of data our website stores on a site visitor's hard drive and accesses each time you visit so we can improve your access to our site, better understand how you use our site, and serve you content that may be of interest to you. For instance, we store a cookie when you log in to our shopping cart so that we can maintain your shopping cart should you not complete checkout. These cookies do not directly store your personal information, but they do support the ability to uniquely identify your internet browser and device.
Please note: Clearing your browser cookies at any time will undo preferences saved here. The option selected here will apply only to the device you are currently using.