
1 item has been added to your cart.
The Graph Editor was introduced in Stata 10.
|
| Order |
With Stata’s new Graph Editor, you can change how your graph looks. You can add. You can remove. You can move. You can modify. Anything. Titles, legends, axes, lines, arrows, markers, annotations.
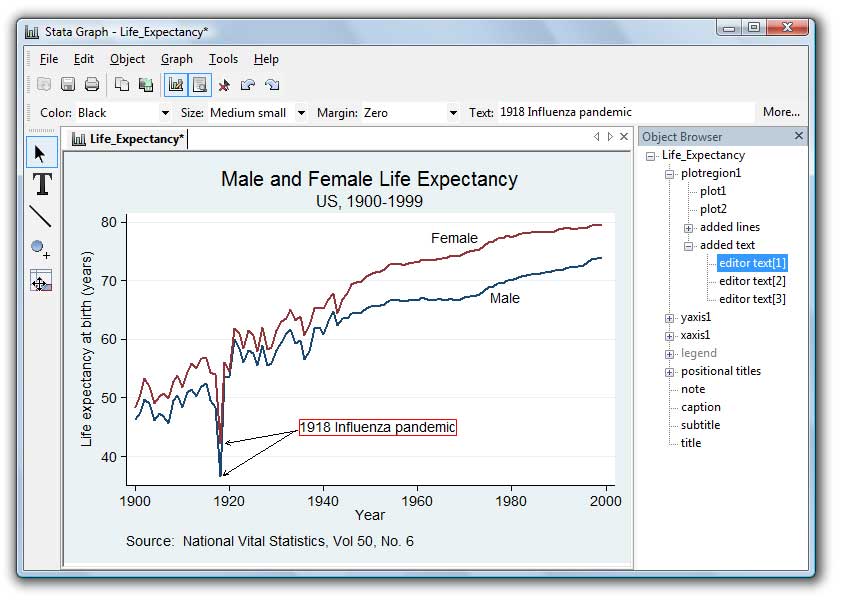
| Add lines and arrows with the Add-line Tool. | Add text with the Add-text Tool. | |
|
Move titles, legends, lines, etc., by dragging. |
Change a scatterplot to a line plot (or any kind of plot to any other
kind of plot) from the contextual toolbar. | |
| Change the aspect ratio from the contextual toolbar. |
Change the properties—color, size, alignment—of any
object—titles, legends, lines, axes, etc.—by
double-clicking on it. | |
|
Customize the look of a point and add, remove,
or customize its label by right-clicking on the point. |
Add new axis ticks and add, remove, or customize labels by
right-clicking on the axis. | |
|
Change spacing between bars, or make them overlap, or stack them, or
convert them to percentages, by right-clicking on the graph. |
Hide an object, or lock its position, by right-clicking. | |
| ||
So it’s easy: move your mouse to where you want to make a change; click, double-click, or right-click; and within a few seconds you’ll have it figured out.
For a complete list of what’s new in Stata graphics, click here.


