
IRT (item response theory)
- Binary response models
- One-parameter logistic (1PL)
- Two-parameter logistic (2PL)
- Three-parameter logistic (3PL)
- Ordinal response models
- Rating scale
- Graded response
- Partial credit
- Categorical response model
- Nominal response
- Hybrid models with differing response types
- Graphs
- Item characteristic curve
- Test characteristic curve
- Item information function
- Test information function
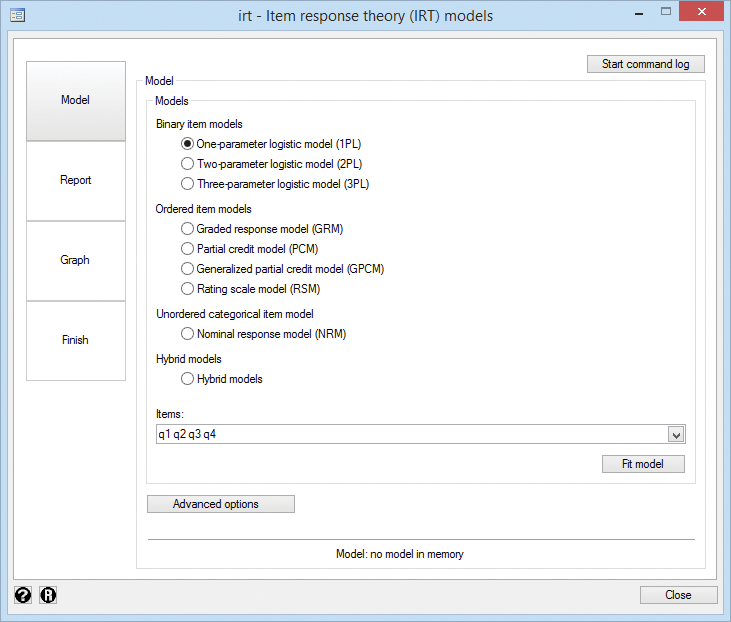
- Control panel to guide you through the analysis
What's this about?
IRT stands for "item response theory". IRT models explore the relationship between a latent (unobserved) trait and items that measure aspects of the trait. This often arises in standardized testing, where the items are a set of questions and the trait, an unobserved ability.
IRT is used when new tests (instruments) are developed, when analyzing and scoring data collected from these tests, when comparing tests that measure the same trait, and more.
Let's see it work
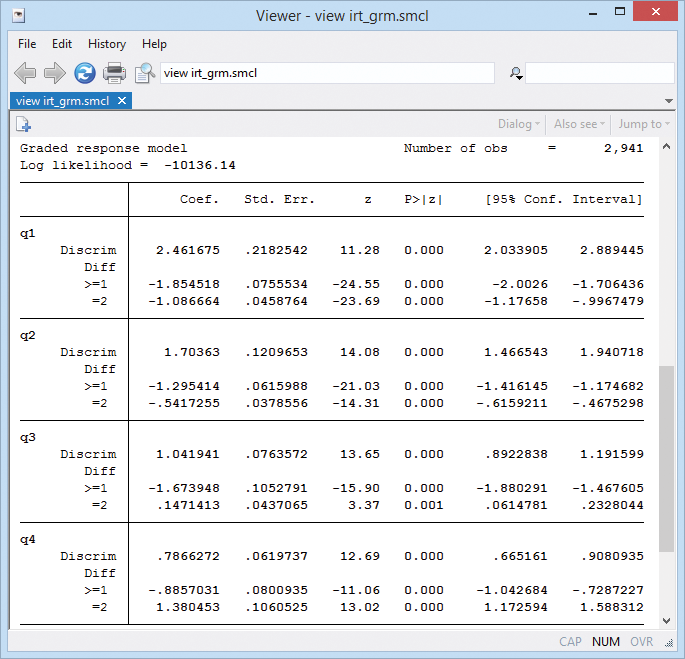
We have a test designed to assess mathematical ability based on four questions (aka, items) that are scored incorrect (0) or correct (1). We fit a one-parameter logistic model by typing irt 1pl q1-q4. Or we fit our model from IRT's Control Panel (shown above).
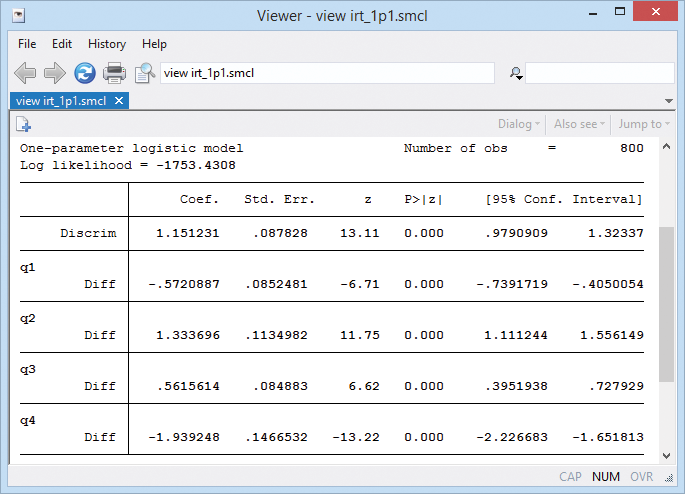
Coefficients labeled Diff report difficulty; question 4's coefficient is −1.94—it's the easiest—and q2 at 1.33 is the most difficult.
We can visualize the relationship between questions and mathematical ability—between the items and latent trait—by graphing the item characteristic curves (ICCs) using irtgraph icc.
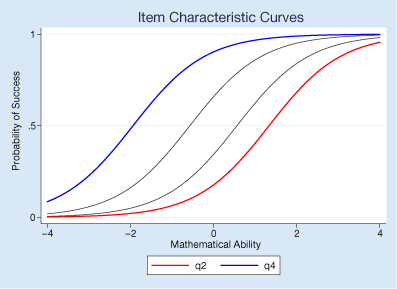
We made the easiest question blue and the hardest one red. The probability of succeeding on the easiest is higher than it is for the hardest. In this case, that's true for every level of ability. We fit a 1PL model. 2PL and 3PL would not have prevented curves from crossing each other.
irtgraph tif graphs the test information function.
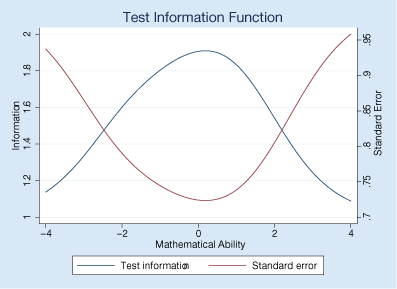
This graph combines all the questions and shows where on the scale of mathematical ability we get the most from our test in terms of information. We wish the curves were flatter.
Stata can analyze ordinal and categorical responses, too. Here's another four-item test in which responses are graded. Each problem is scored 0 (incorrect), 1 (partially correct), or 2 (correct).
With these ordinal data, we will fit a graded response model (we could instead fit a partial-credit model or a rating-scale model). We type irt grm q1-q4.
Here's the category characteristic curve showing how question 3 relates to mathematical ability. We use irtgraph icc.
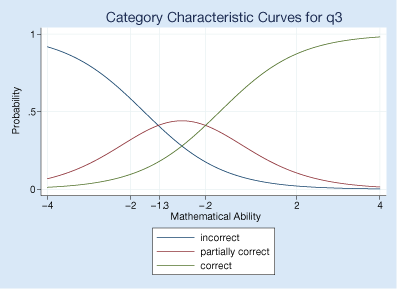
Respondents with mathematical ability levels below −1.3 are most likely to answer q3 with a completely incorrect answer, those with levels between −1.3 and −0.2 are most likely to give a partially correct answer, and those with ability levels above −0.2 are most likely to give a completely correct answer. Question 3 focuses on the lower levels of mathematical ability.
From the test characteristic curve produced by irtgraph tcc, we see how the expected total test score relates to mathematical ability levels.
If we had the space, we'd show you the test characteristic curve. You would see that out of a possible 8 points on the test, a person with above-average mathematical ability would be expected to score above 5.
Not interested in standardized testing?
IRT models can be used to measure many types of latent traits. For example,
- attitudes
- personality traits
- health outcomes
- quality of life
Use IRT for analyzing any unobservable characteristic for which binary or categorical measurements are observed.
Upgrade now Order StataRead even more about IRT.


