The input data for the survival-analysis features are duration records: each observation records a span of time over which the subject was observed, along with an outcome at the end of the period. There can be one record per subject or, if covariates vary over time, multiple records.
You can obtain simple descriptions:
. webuse cancer
(Patient survival in drug trial)

. stset studytime died

Survival-time data settings

         Failure event: died!=0 & died<.
Observed time interval: (0, studytime]
     Exit on or before: failure
| 48 total observations |
| 0 exclusions |
| 48 observations remaining, representing |
| 31 failures in single-record/single-failure data |
| 744 total analysis time at risk and under observation |
| At risk from t = 0 |
| Earliest observed entry t = 0 |
| Last observed exit t = 39 |
| Per subject | |||||
| Category Total Mean Min Median Max | |||||
| Number of subjects 48 | |||||
| Number of records 48 1 1 1 1 | |||||
| Entry time (first) 0 0 0 0 | |||||
| Exit time (final) 15.5 1 12.5 39 | |||||
| Subjects with gap 0 | |||||
| Time on gap 0 | |||||
| Time at risk 744 15.5 1 12.5 39 | |||||
| Failures 31 .6458333 0 1 1 | |||||
| ||||||||||
| dose | Time at risk rate subjects 25% 50% 75% | |||||||||
| Control | 180 .1055556 20 4 8 12 | |||||||||
| 5 mg | 209 .0287081 14 13 22 23 | |||||||||
| 10 mg | 355 .0169014 14 25 33 . | |||||||||
| Total | 744 .0416667 48 8 17 33 | |||||||||
You can also compare the survivor functions
. sts list, by(dose) compare

        Failure _d: died
  Analysis time _t: studytime

Kaplan–Meier survivor function
By variable: dose
| dose Control 5 mg 10 mg |
| Time 1 0.9000 1.0000 1.0000 |
| 5 0.6000 1.0000 1.0000 |
| 9 0.4500 0.8512 0.9286 |
| 13 0.2250 0.7448 0.8571 |
| 17 0.1125 0.6207 0.8571 |
| 21 0.1125 0.6207 0.8571 |
| 25 . 0.2069 0.6857 |
| 29 . 0.2069 0.5878 |
| 33 . . 0.4408 |
| 37 . . 0.4408 |
| 41 . . . |
or you can review the complete life table:
. sts list, by(dose)

        Failure _d: died
  Analysis time _t: studytime

Kaplan–Meier survivor function
By variable: dose
| At Net Survivor Std. |
| Time risk Fail lost function error [95% conf. int.] |
| Control |
| 1 20 2 0 0.9000 0.0671 0.6560 0.9740 |
| 2 18 1 0 0.8500 0.0798 0.6038 0.9490 |
| 3 17 1 0 0.8000 0.0894 0.5511 0.9198 |
| 4 16 2 0 0.7000 0.1025 0.4505 0.8525 |
| (output omitted) |
| 23 1 1 0 0.0000 . . . |
| 5 mg |
| 6 14 1 1 0.9286 0.0688 0.5908 0.9896 |
| 7 12 1 0 0.8512 0.0973 0.5234 0.9607 |
| 9 11 0 1 0.8512 0.0973 0.5234 0.9607 |
| 10 10 0 1 0.8512 0.0973 0.5234 0.9607 |
| (output omitted) |
| 32 1 0 1 0.2069 0.1769 0.0104 0.5804 |
| 10 mg |
| 6 14 1 0 0.9286 0.0688 0.5908 0.9896 |
| 10 13 1 0 0.8571 0.0935 0.5394 0.9622 |
| 17 12 0 1 0.8571 0.0935 0.5394 0.9622 |
| 19 11 0 1 0.8571 0.0935 0.5394 0.9622 |
| (output omitted) |
| 39 1 0 1 0.4408 0.1673 0.1312 0.7187 |
Just as easily, you can obtain a graph
. sts graph, by(dose)
;)
or test the equality of the survivor functions:
. sts test dose

        Failure _d: died
  Analysis time _t: studytime

Equality of survivor functions
Log-rank test
| Observed Expected | ||
| dose | events events | |
| Control | 19 7.25 | |
| 5 mg | 6 8.20 | |
| 10 mg | 6 15.56 | |
| Total | 31 31.00 |
We used the log-rank test, but we could have specified the Wilcoxon–Breslow–Gehan test, the Tarone–Ware test, the Peto–Peto–Prentice test, or the Fleming–Harrington test.
We could also perform stratified versions of these tests to control for an external covariate:
. generate agecat = 1

. replace agecat = 2 if age > 55
(25 real changes made)

. replace agecat = 3 if age > 60
(11 real changes made)

. tabulate agecat
| agecat | Freq. Percent Cum. | |
| 1 | 23 47.92 47.92 | |
| 2 | 14 29.17 77.08 | |
| 3 | 11 22.92 100.00 | |
| Total | 48 100.00 |
| Observed Expected | ||
| dose | events events* | |
| Control | 19 7.37 | |
| 5 mg | 6 9.67 | |
| 10 mg | 6 13.95 | |
| Total | 31 31.00 |
Stata can fit Cox proportional hazards, exponential, Weibull, Gompertz, lognormal, log-logistic, and gamma models. In addition, it can fit models for competing risks, parametric and semiparametric models for interval-censored data, and marginal Cox models for interval-censored multiple-event data. Stata can also fit Bayesian parametric survival models. In the case of traditional Cox models for right-censored data,
simple and stratified estimates are available
right censoring, left truncation (delayed entry), intermediary gaps are allowed
conventional and robust estimates of variance are available (Lin and Wei 1989)
The same is true of the parametric models. For exponential and Weibull models, estimates are available in either the accelerated-time or hazard metric.
Here we will focus on the Cox proportional hazards model using a model fitted on our dose–age data that we described above:
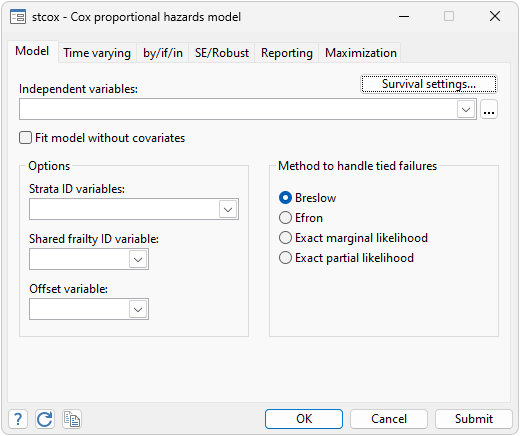
. stcox age i.dose

        Failure _d: died
  Analysis time _t: studytime

Iteration 0:   log likelihood = -99.911448
Iteration 1:   log likelihood = -82.331523
Iteration 2:   log likelihood = -81.676487
Iteration 3:   log likelihood = -81.652584
Iteration 4:   log likelihood = -81.652567
Refining estimates:
Iteration 0:   log likelihood = -81.652567

Cox regression with Breslow method for ties

No. of subjects =  48                                   Number of obs =     48
No. of failures =  31
Time at risk    = 744
                                                        LR chi2(3)    =  36.52
Log likelihood = -81.652567                             Prob > chi2   = 0.0000
| _t | Haz. ratio Std. err. z P>|z| [95% conf. interval] | |
| age | 1.118334 .0409074 3.06 0.002 1.040963 1.201455 | |
| dose | ||
| 5 mg | .1805839 .0892742 -3.46 0.001 .0685292 .4758636 | |
| 10 mg | .0520066 .034103 -4.51 0.000 .0143843 .1880305 | |
By default, stcox uses Breslow’s method for handling ties and presents results as hazard ratios—that is, exponentiated coefficients—but we can see the underlying coefficients if we wish:
. stcox, nohr

Cox regression with Breslow method for ties

No. of subjects =  48                                   Number of obs =     48
No. of failures =  31
Time at risk    = 744
                                                        LR chi2(3)    =  36.52
Log likelihood = -81.652567                             Prob > chi2   = 0.0000
| _t | Coefficient Std. err. z P>|z| [95% conf. interval] | |
| age | .11184 .0365789 3.06 0.002 .0401467 .1835333 | |
| dose | ||
| 5 mg | -1.71156 .4943639 -3.46 0.001 -2.680495 -.7426241 | |
| 10 mg | -2.956384 .6557432 -4.51 0.000 -4.241617 -1.671151 | |
stcox can also handle ties using Efron’s method, the exact partial-likelihood method, or the exact marginal-likelihood method.
We can as easily fit the model with robust estimates of variance:
. stcox age i.dose, vce(robust)

        Failure _d: died
  Analysis time _t: studytime

Iteration 0:   log pseudolikelihood = -99.911448
Iteration 1:   log pseudolikelihood = -82.331523
Iteration 2:   log pseudolikelihood = -81.676487
Iteration 3:   log pseudolikelihood = -81.652584
Iteration 4:   log pseudolikelihood = -81.652567
Refining estimates:
Iteration 0:   log pseudolikelihood = -81.652567

Cox regression with Breslow method for ties

No. of subjects =  48                                   Number of obs =     48
No. of failures =  31
Time at risk    = 744
                                                        Wald chi2(3)  =  32.39
Log pseudolikelihood = -81.652567                       Prob > chi2   = 0.0000
| Robust | ||
| _t | Haz. ratio std. err. z P>|z| [95% conf. interval] | |
| age | 1.118334 .0327643 3.82 0.000 1.055926 1.18443 | |
| dose | ||
| 5 mg | .1805839 .0773571 -4.00 0.000 .0779917 .4181288 | |
| 10 mg | .0520066 .0349232 -4.40 0.000 .0139465 .1939333 | |
By using predict after stcox, we can obtain the following:
baseline hazard (and stratified baseline hazard if estimates are stratified)
cumulative baseline hazard
baseline survivor function (and stratified baseline survivor function if estimates are stratified)
martingale residuals
Cox–Snell residuals
deviance residuals
likelihood displacement values
LMAX measures of influence
log-frailties
efficient score residuals
DFBETA measures of influence
Schoenfeld residuals
scaled Schoenfeld residuals
The data used above have censored observations but no time-varying covariates and no left truncation. The failure event—death—occurs only once. Had the data included time-varying covariates, left truncation, or recurring failure events, however, nothing would have changed in terms of what we type, and importantly, all the same features are available postestimation regardless of the characteristics of the data.
We can also fit Cox (as well as parametric) models with random effects.
Known as
. webuse catheter, clear
(Kidney data, McGilchrist and Aisbett, Biometrics, 1991)

. stset time infect

Survival-time data settings

         Failure event: infect!=0 & infect<.
Observed time interval: (0, time]
     Exit on or before: failure
| 76 total observations |
| 0 exclusions |
| 76 observations remaining, representing |
| 58 failures in single-record/single-failure data |
| 7,424 total analysis time at risk and under observation |
| At risk from t = 0 |
| Earliest observed entry t = 0 |
| Last observed exit t = 562 |
| _t | Haz. ratio Std. err. z P>|z| [95% conf. interval] | |
| age | 1.006202 .0120965 0.51 0.607 .9827701 1.030192 | |
| female | .2068678 .095708 -3.41 0.001 .0835376 .5122756 | |
| theta | .4754497 .2673108 | |
Lin, D. Y. and L. J. Wei. 1989. The robust inference of the Cox proportional hazards model. Journal of the American Statistical Association 84: 1074–1078.


