Notice: On April 23, 2014, Statalist moved from an email list to a forum, based at statalist.org.
[Date Prev][Date Next][Thread Prev][Thread Next][Date Index][Thread Index]
Re: st: level and distribution plot side by side
From
annoporci <[email protected]>
To
[email protected]
Subject
Re: st: level and distribution plot side by side
Date
Mon, 07 Jan 2013 03:39:31 +0800
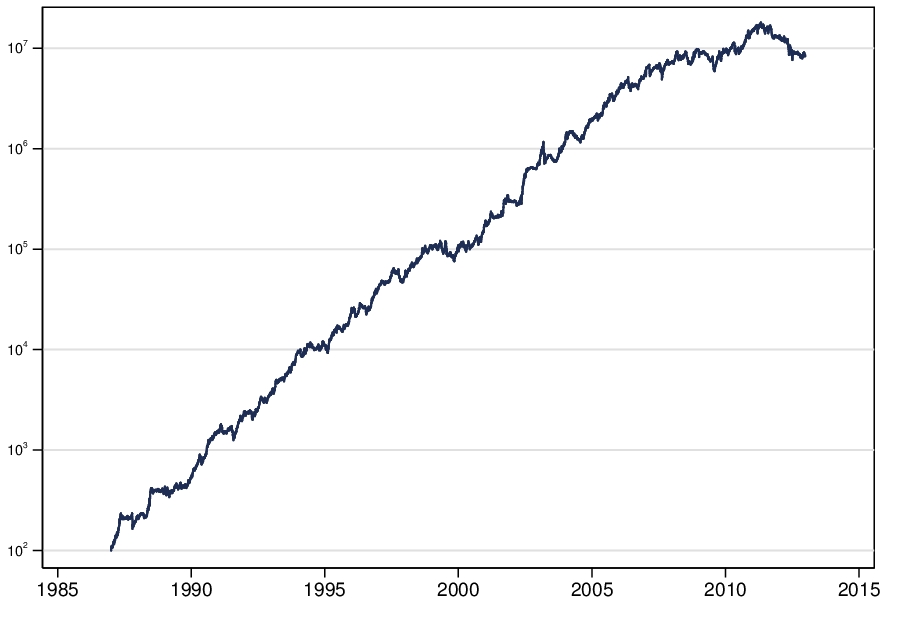
Is there a simple way to have the powers of 10 printed as
superscripts rather than as a caret(^)?
Yes; Rense refers to it in the blog entry you cited.
Use {sup:#} as explained in -help text- and

http://www.stata.com/help.cgi?text

Nick
Excellent, thanks.
Rense writes "the superscripts end up too far from the other characters"
but I have not found that, it looks just right for me, perhaps we use
different fonts or different font sizes:
http://www1.picturepush.com/photo/a/11892364/img/11892364.jpg

For the record, here is the amended code for powers of 10:

local vallabel = ""
forval x = `expmin'(`expstp')`expmax'{
    local y = 10^`x'
    local vallabel =  `"`vallabel'`y' "10{superscript:`x'}" "'
}

where one previously defines, say:

   local expmin = 2
   local expstp = 1
   local expmax = 7

The rest of the code is as posted on Rense's blog.

--
Patrick Toche.
*
*   For searches and help try:
*   http://www.stata.com/help.cgi?search
*   http://www.stata.com/support/faqs/resources/statalist-faq/
*   http://www.ats.ucla.edu/stat/stata/