Notice: On April 23, 2014, Statalist moved from an email list to a forum, based at statalist.org.
[Date Prev][Date Next][Thread Prev][Thread Next][Date Index][Thread Index]
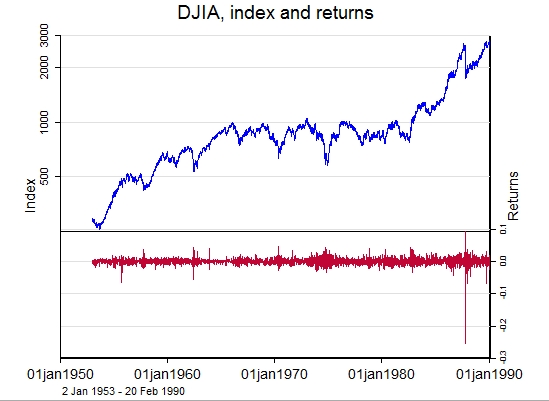
Re: st: level and distribution plot side by side
From
annoporci <[email protected]>
To
[email protected]
Subject
Re: st: level and distribution plot side by side
Date
Sun, 06 Jan 2013 03:24:59 +0800
Problem solved:

follow-up on my previous post: answering my own question (sigh)

First off, there was a major problem with the code and image I posted, and
that's I forgot to -tsset- with the calendar date, with the result that
the growth-rate plot was all wrong.

Secondly, I was able to get the plot to look alright by manipulating the
range inside yscale. Previously I was playing around with plotregion and
graphregion and didn't think about doing that. The result below is
acceptable, I think.

I also removed the xtitle and fixed the format of the second axis labels.

use "C:\stata\dow1",clear
   tsset t
   generate dayofwk = dow(date)
   list date dayofwk t ln_dow D.ln_dow in 1/8
   list date dayofwk t ln_dow D.ln_dow in -8/l
   generate Dlndow = D.ln_dow
   tsset date
   #delimit ;
   twoway (tsline dowclose, yaxis(1) lcolor(blue))
          (spike Dlndow date, yaxis(2) lcolor(cranberry))
        , yscale(log axis(1) range(50 3000))
          ylabel(500 1000 2000 3000, grid labsize(small) axis(1))
		ytitle("Index", axis(1))
          yline(250, axis(1) lstyle(foreground))
		yscale(range(-.3 .7) axis(2))
          ylabel(-.3 -.2 -.1 0 +.1, grid labsize(vsmall) format(%9.1f)
axis(2))
		ytitle("Returns", axis(2))
          legend(off)
		xtitle("")
          title("DJIA, index and returns", margin(b+2.5))
		note("2 Jan 1953 - 20 Feb 1990")
          graphregion(fcolor(none) margin(none))
          plotregion(margin(none))
		aspect(0.75)
   ; #delimit cr


Output:
http://www5.picturepush.com/photo/a/11883508/img/11883508.jpg

--
Patrick Toche.
*
*   For searches and help try:
*   http://www.stata.com/help.cgi?search
*   http://www.stata.com/support/faqs/resources/statalist-faq/
*   http://www.ats.ucla.edu/stat/stata/