Notice: On April 23, 2014, Statalist moved from an email list to a forum, based at statalist.org.
Attachment:
test.png
[Date Prev][Date Next][Thread Prev][Thread Next][Date Index][Thread Index]
st: xtgraph question
From
"Earl, Jennifer Suzanne - (jenniferearl)" <[email protected]>
To
"[email protected]" <[email protected]>
Subject
st: xtgraph question
Date
Thu, 25 Oct 2012 22:11:36 +0000
Hi folks,
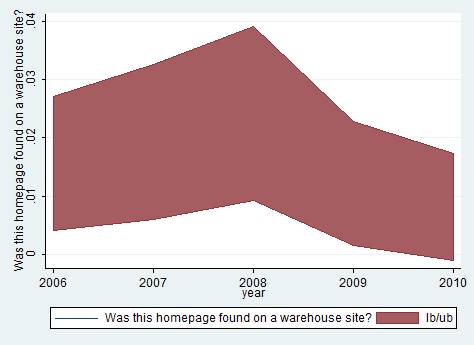
I am trying to graph a mean and its confidence interval over time with:
xtgraph whsite , bartype(rarea)
But, you actually can't see the mean line because the area for the confidence interval covers it up (example attached). I have tried lots of different options like foreground, changing the fill intensity, etc. But, what I really need is something equivalent to moving the average line to the front. Does anyone have any thoughts on this? I can see how others have done it outside of xtgraph, but that is not working for me within xtgraph.
Thanks,
Jenn
***********************************
Jennifer Earl
Professor of Sociology
Social Sciences 421
University of Arizona
Tucson, AZ 85721-0027
Phone: (520) 621-3296
***********************************
Description: test.png