Notice: On April 23, 2014, Statalist moved from an email list to a forum, based at statalist.org.
[Date Prev][Date Next][Thread Prev][Thread Next][Date Index][Thread Index]
Re: st: time series graph
From
Partho Sarkar <[email protected]>
To
[email protected]
Subject
Re: st: time series graph
Date
Fri, 16 Sep 2011 21:00:42 +0530
Say your y variable is "yvar", and the recession years are 1920, 1930
etc. The following is one way to do what you ask:
--------------------------CODE BEGIN----------------------
gen float maxy = max(yvar)
gen recession=.
replace recession==1 if inlist(year,1920,1930,....)
twoway (scatter yvar year) ///
(bar maxy year if recession==1,color(ltkhaki))
--------------------------CODE END----------------------
Partha Sarkar
On Fri, Sep 16, 2011 at 5:43 PM, Maria Ana Vitorino
<[email protected]> wrote:
> Dear Stata-List users,
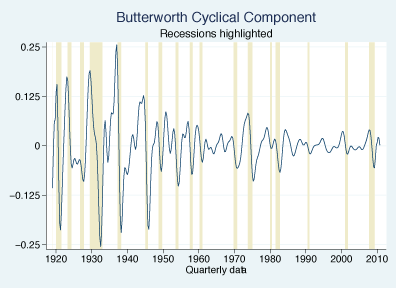
> Can anyone tell me what do I need to do to replicate the effect in the
> following graph?, i.e. how do I "highlight" the recessions?
> http://blog.stata.com/wp-content/uploads/2011/06/page3_t4.gif
> Thanks!
> Ana
> *
> * For searches and help try:
> * http://www.stata.com/help.cgi?search
> * http://www.stata.com/support/statalist/faq
> * http://www.ats.ucla.edu/stat/stata/
>
*
* For searches and help try:
* http://www.stata.com/help.cgi?search
* http://www.stata.com/support/statalist/faq
* http://www.ats.ucla.edu/stat/stata/