Yes, Rajesh,
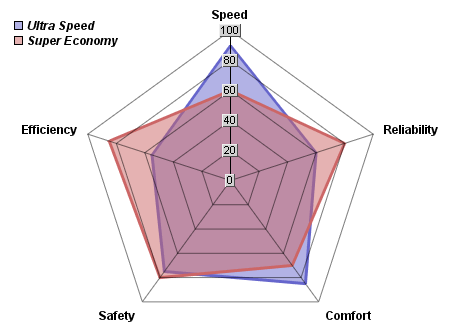
I want the effect (not the graph) similar to this one:
http://www.advsofteng.com/images/multiradar_g.png
And it needs to be programmable, no Graph Editing tricks (as there
could be multiple of series there).
Regards, Sergiy
On Mon, Sep 29, 2008 at 6:23 PM, Rajesh Tharyan <[email protected]> wrote:
> On second thoughts.. that is probably not what you want. You don't want the
> color to be none. But anything else but none! But still be able to see
> through..
>
> Sorry!
>
> rajesh
>
> -----Original Message-----
> From: [email protected]
> [mailto:[email protected]] On Behalf Of Rajesh Tharyan
> Sent: 29 September 2008 23:17
> To: [email protected]
> Subject: st: RE: Transparent graph
>
> Hi,
>
> In the graph editor ( stata 10.1)
>
>
> After creating the graphs using your code.
>
> I go can then go to the graph editor, area properties
>
> Set the color to none
> Check the different outline color and set it to black or whatever color. You
> can see one graph through the other
>
> If it can be don't through the graph editor I am sure it can be done from
> the command line
>
> Cheers
> rajesh
>
>
> Tel: +44 (0)1392 262544
> Fax: +44 (0)1392 262475
> E-mail: [email protected]
>
> Times Higher Education University of the Year 2007/08
>
> -----Original Message-----
> From: [email protected]
> [mailto:[email protected]] On Behalf Of Sergiy Radyakin
> Sent: 29 September 2008 18:29
> To: [email protected]
> Subject: st: Transparent graph
>
> Dear All,
>
> I am writing a graphing procedure (directly with Stata's undocumented
> gdi commands). There is a pseudo-transparency effect as can be seen
> below:
>
> sysuse auto, clear
> generate ww = weight * 2.85
> twoway area price ww l, sort fi(100 100)
> twoway area price ww l, sort fi(30 30)
>
> Is it possible to achieve "true-transparency" (where the first "blue"
> graph could be seen through the second "pink")?
>
> In technical terms: does gdi shadelevel set color or the method of
> drawing (SET,OR,AND,XOR)? I.e. is it equivalent to
> gdi shadergb = `i' * `R' `i' * `G' `i' * `B'
> ??
>
> Thank you,
> Sergiy Radyakin
*
* For searches and help try:
* http://www.stata.com/help.cgi?search
* http://www.stata.com/support/statalist/faq
* http://www.ats.ucla.edu/stat/stata/
