Spatial autoregressive models using Stata
Example: Texas homicide rate

- High homicide-rate counties are surrounded by high homicide-rate neighbors.
- Low homicide-rate counties are surrounded by low homicide-rate neighbors.
Some researchers want to analyze the effect of unemployment rate on homicide rate in Texas counties. They suspect that the homicide rate in one county would affect the other counties.
They want to
Set up a model that allows the homicide rate in one county to affect the homicide rate in other counties, and
Determine how an increase in unemployment rate in one county would change the homicide rate in other counties.
SAR model
We need a model that allows spatial dependence in the homicide rate. That is,
$$ \begin{aligned} \text{hrate}_i = \beta_0 + \beta_1*\text{unemployment}_{i} + \lambda* \color{red} \text{hrate}_{\text{neighbors of }i} \color{black} + errors \end{aligned} $$We use a matrix W to define “neighbors”. W defines who are connected with whom and how strong their relationships are.
$$
\begin{aligned}
\text{hrate} = \beta_0 + \beta_1*\text{unemployment}
+ \lambda* \color{red} W*\text{hrate}
\color{black} + errors
\end{aligned}
$$
Use spatial weighting matrix to define neighbors
A spatial weighting matrix W summarizes spatial relations between n spatial units.
$$
\begin{aligned}
W = \begin{bmatrix}
0 & w_{12} & w_{13} & \ldots & w_{1n} \\
w_{21} & 0 & w_{23} & \ldots & w_{2n} \\
\vdots & &\ddots& & \vdots \\
\vdots & &&\ddots& \vdots \\
w_{n1} & w_{n2} &&\ldots &0
\end{bmatrix}_{n\times n}
\end{aligned}
$$
- W is a n × n matrix and wij ≥ 0.
- wij reflects spatial influence of unit j on unit i.
- We exclude self-influence, so the diagonal elements wii are all zero.
Spatial contiguity matrix
- Let’s focus now on only three counties. For simplicity, let’s call them County A, County B, and County C.

- One type of W matrix is the contiguity matrix, which defines neighbors as counties who share a common border. For example,
$$
\begin{aligned}
W &=
\begin{matrix}
& A & B & C \\
A & 0 & 1 & 0 \\
B & 1 & 0 & 1 \\
C & 0 & 1 & 0
\end{matrix}
\end{aligned}
$$
Spatial inverse-distance matrix
- In this example, we assume distances are the same going in both directions.

- We could create an inverse-distance matrix based on the distance between county centroids.
$$
\begin{aligned}
W &=
\begin{matrix}
& A & B & C \\
A & 0 & 1/50 & 1/125 \\
B & 1/50 & 0 & 1/75 \\
C & 1/125 & 1/75 & 0
\end{matrix}
\end{aligned}
$$
Use spmatrix to define the spatial weighting matrix
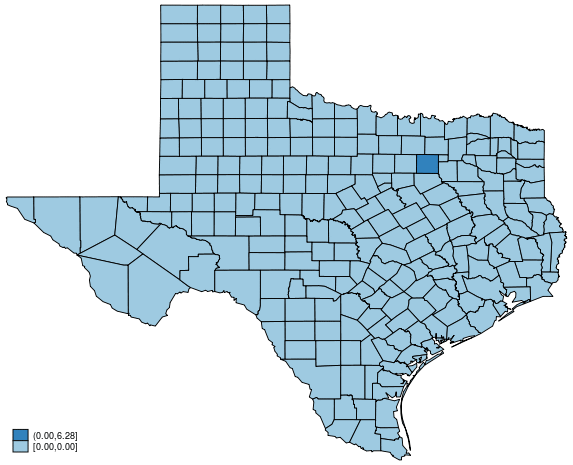
- Let’s take a look at our data, where _CX is longitude and _CY is latitude for the centroid of the county.
. use texas, clear
(S.Messner et al.(2000), U.S southern county homicide rates in 1990)

. list _CX _CY cname hrate unemployment in 1/7, abbreviate(12)

     +-----------------------------------------------------------+
     |        _CX         _CY       cname   hrate   unemployment |
     |-----------------------------------------------------------|
  1. | -100.27156   36.275086    Lipscomb    0.00           1.73 |
  2. |  -101.8931   36.273254     Sherman    0.00           3.34 |
  3. | -102.59591    36.27355      Dallam   18.31           2.28 |
  4. | -101.35351   36.272304    Hansford    0.00           4.01 |
  5. | -100.81561   36.273178   Ochiltree    3.65           4.87 |
     |-----------------------------------------------------------|
  6. | -100.81482   35.840515     Roberts    0.00           3.24 |
  7. | -100.26948   35.839961    Hemphill    0.00           4.14 |
     +-----------------------------------------------------------+
- The contiguity matrix defines neighbors as counties who share a common border.
. spmatrix create contiguity W
Use spregress to fit an SAR model
$$
\begin{aligned}
\text{hrate} = \beta_0 + \beta_1*\text{unemployment}
+ \lambda* \color{red} W*\text{hrate}
\color{black} + errors
\end{aligned}
$$
spregress hrate unemployment, dvarlag(W) gs2slsOption dvarlag(W) means spatial lag for the dependent variable (hrate).
Option gs2sls means to use the generalized spatial two-stage least-squares estimator.
Use spregress to fit an SAR model
. spregress hrate unemployment, dvarlag(W) gs2sls
  (254 observations)
  (254 observations (places) used)
  (weighting matrix defines 254 places)

Spatial autoregressive model                    Number of obs     =        254
GS2SLS estimates                                Wald chi2(2)      =      14.23
                                                Prob > chi2       =     0.0008
                                                Pseudo R2         =     0.0424

------------------------------------------------------------------------------
       hrate |      Coef.   Std. Err.      z    P>|z|     [95% Conf. Interval]
-------------+----------------------------------------------------------------
hrate        |
unemployment |   .4584241    .152503     3.01   0.003     .1595237    .7573245
       _cons |   2.720913   1.653105     1.65   0.100    -.5191143    5.960939
-------------+----------------------------------------------------------------
W            |
       hrate |   .3414964   .1914865     1.78   0.075    -.0338103    .7168031
------------------------------------------------------------------------------
Wald test of spatial terms:          chi2(1) = 3.18       Prob > chi2 = 0.0745
- We need to understand spatial spillover in order to interpret the results.
Understand spatial spillover (I)
Let us do an experiment. We will ask a concrete question.
If the unemployment rate in Dallas increases to 20%, how would the homicide rate change in the other counties?
Based on our estimation from spregress, we can proceed in three steps.
Predict the homicide rate using the original data.
Change Dallas’s unemployment rate to 20% and predict the homicide rate again.
Compute the difference between two predictions and map it.
Understand spatial spillover (II)
. preserve /* save data temporarily */

.
. /* Step 1: predict homicide rate using original data */
. predict y0
(option rform assumed; reduced-form mean)

. /* Step 2: change Dallas unemployment rate to 20%, and predict again*/
. replace unemployment = 20 if cname == "Dallas"
(1 real change made)

. predict y1
(option rform assumed; reduced-form mean)

. /* Step 3: Compute the prediction difference and map it*/
. generate double y_diff = y1 - y0

. grmap y_diff, title("Global spillover")

.
. restore /* return to original data */
Understand spatial spillover (III)

- Because the effect is not only on the direct neighbors of Dallas, we call this global spillover.
Magic of spatial spillover
$$
\begin{aligned}
\text{hrate} = \beta_0 + \beta_1*\text{unemployment}
+ \lambda* \color{red} W*\text{hrate}
\color{black} + errors
\end{aligned}
$$
- unemployment in Dallas increases to 20%.
- hrate in Dallas will increase.
- Because Dallas is a neighbor of other counties, Dallas’s neighboring counties’ hrates will increase.
- Because Dallas’s neighbors have other neighbors, these neighbors of neighbors’ hrates will increase. This process repeats so that many counties are affected, but the effect on counties far from Dallas is very weak.
Dynamic process of spatial spillover
Use estat impact to measure the spatial spillover
. estat impact

progress   :100%

Average impacts                                 Number of obs     =        254

------------------------------------------------------------------------------
             |            Delta-Method
             |      dy/dx   Std. Err.      z    P>|z|     [95% Conf. Interval]
-------------+----------------------------------------------------------------
direct       |
unemployment |   .4666538   .1539861     3.03   0.002     .1648466    .7684609
-------------+----------------------------------------------------------------
indirect     |
unemployment |   .1910068   .1565581     1.22   0.222    -.1158414     .497855
-------------+----------------------------------------------------------------
total        |
unemployment |   .6576605   .2519366     2.61   0.009     .1638739    1.151447
------------------------------------------------------------------------------
- $\frac{d y}{d x}$ is the marginal effect of the unemployment rate on the homicide rate.
- The direct impact is 0.47, so the average marginal effect of the unemployment rate on the homicide rate in the same county is 0.47.
- The indirect impact is 0.19, so the average marginal effect in the other counties is 0.19.
Average direct impact
The direct impact in one county is the marginal effect of the unemployment rate in one county on the homicide rate in the same county.
- Direct impact (DI) in Dallas
$$ \text{DI}_{\text{Dallas}} = \frac{d \text{ hrate}_{\text{Dallas}}} {d \text{ unemployment}_{\text{Dallas}}} $$
- Direct impact (DI) in Dallas
The average direct impact is the average of direct impact in each county.
$$
\begin{aligned}
\text{Average direct impact}_{\text{Texas}} =
\frac{1}{254}(\text{DI}_{\text{Dallas}}
+ \text{DI}_{\text{Houston}}
+\ldots)
\end{aligned}
$$
Average indirect impact
The indirect impact in one county is the sum of marginal effects of the unemployment rate in all the counties except county i on the homicide rate in county i.
- Indirect impact (IDI) in Dallas
$$
\begin{aligned}
\text{IDI}_{\text{Dallas}} =
\frac{d \text{ hrate}_{\text{Dallas}}}{d \text{ unemployment}_{\text{Houston}}}
+
\frac{d \text{ hrate}_{\text{Dallas}}}{d \text{ unemployment}_{\text{Brazos}}}
+ \ldots
\end{aligned}
$$
(where the “…” $\color{red}\text{ does not include }$ $\frac{d \text{ hrate}_{\text{Dallas}}}{d \text{ unemployment}_{\text{Dallas}}}$ )
- The average indirect impact is the average of indirect impacts over all the counties.
$$ \begin{aligned} \text{Average indirect impact}_{\text{Texas}} = \frac{1}{254}(\text{IDI}_{\text{Dallas}} + \text{IDI}_{\text{Houston}} + \ldots) \end{aligned} $$
Average total impact
Total impact in one county is the sum of marginal effects of the unemployment rate in all the counties on the homicide rate in county i.
- Total impact (TI) in Dallas
$$ \begin{aligned} \text{Total impact}_{\text{Dallas}} &= \frac{d \text{ hrate}_{\text{Dallas}}}{d \text{ unemployment}_{\text{Dallas}}} + \color{red} {\frac{d \text{ hrate}_{\text{Dallas}}}{d \text{ unemployment}_{\text{Houston}}} + \ldots} \\ \\ &=\text{Direct impact}_{\text{Dallas}} + \color{red}{\text{Indirect impact}_{\text{Dallas}}} \end{aligned} $$Average total impact is just the sum of average direct and indirect impacts.
$$ \begin{aligned} \text{Average total impact} &= \text{Average direct impact} + \text{Average indirect impact} \end{aligned} $$
Use margins and predict for policy analysis
Question: if the unemployment rate drops by 1% for each county, what is its effect on the homicide rate?
. margins, at(unemployment=generate(unemployment))        ///
>         at(unemployment=generate(unemployment-1))

Adjusted predictions                            Number of obs     =        254

Expression   : Reduced-form mean, predict()

1._at        : unemployment    = unemployment

2._at        : unemployment    = unemployment-1

------------------------------------------------------------------------------
             |            Delta-method
             |     Margin   Std. Err.      z    P>|z|     [95% Conf. Interval]
-------------+----------------------------------------------------------------
         _at |
          1  |   8.352163   .6395964    13.06   0.000     7.098577    9.605748
          2  |   7.694502   .6755559    11.39   0.000     6.370437    9.018567
------------------------------------------------------------------------------
- On average, the hrate will drop from 8.4% to 7.7%.
Overview of the Sp suite of commands
Workflow

spregress: cross-sectional data spatial autoregressive model
The general model that spregress is designed to fit is
$$ \begin{align} y &= X \beta + \sum_{k}^{K} W_{k} X \gamma_{k} + \sum_{p=1}^{P} \lambda_p W_{p} y + u \\ u &= \sum_{q=1}^Q \rho_q M_{q} u + \epsilon \end{align} $$- u are the unobserved errors, possibly spatially correlated.
This is the full model that you can fit, but instead of discussing it in detail now, let’s break it into pieces.
Spatial lag of independent variables (WX)
Example: The crime rate in county i depends on the policing intensity in the same county as well as the policing intensity in the neighboring counties.
Code: spregress with option ivarlag()
spregress crime police, ivarlag(W : police) gs2slsModel:
$$ \begin{aligned} \text{crime} = \beta_0 + \beta_1*\text{police} + \gamma*W*\text{police} + errors \end{aligned} $$Spatial Durbin model:
$$ \begin{aligned} y = X\beta + WX\gamma + errors \end{aligned} $$
Outcome y in place i will be $\color{red}\text{affected by the covariate }X \text{ in the }$ $\color{red}\text{neighbors of }$ $\color{red}i$, where the neighbors are defined by W.
Spatial lag of dependent variable (Wy)
Example: The crime rate in one county i depends on the crime rate in the neighbors of county i. A person in one county can possibly commit the crime in the neighboring counties.
Code: spregress with option dvarlag()
spregress crime unemployment, dvarlag(W) gs2slsModel:
$$ \begin{aligned} \text{crime} = \beta_0 + \beta_1*\text{unemployment} + \lambda*W*\text{crime} + errors \end{aligned} $$Spatial lag model:
$$ \begin{aligned} y = X\beta + \lambda Wy + errors \end{aligned} $$
outcome y in place i will be $\color{red}\text{affected by outcome}$ $\color{red}y$ $\color{red}\text{in the neighbors of}$ $\color{red}i$.
Spatial lag of errors (Mu)
Example: Leukemia incidence rate in one block of New York City is affected by the unobserved factors such as chemical pollution in the neighboring blocks.
Code: spregress with option errorlag()
spregress leukemia , errorlag(M) gs2slsModel:
$$ \begin{aligned} \text{leukemia} = \beta_0 + u \quad \text{and } \quad u = \rho M u + \epsilon \end{aligned} $$Spatial error model:
$$ \begin{aligned} y = \beta_0 + X\beta + u \quad \text{and } \quad u = \rho M u + \epsilon \end{aligned} $$
The outcome y in place i is $\color{red}\text{affected by the unobserved factors}$ $\color{red}\text{in the}$ $\color{red}\text{neighbors of}$ $\color{red}i$.
General spatial autoregressive models
Intuition: Spatial dependencies happen through multiple channels. Outcome depends on neighbors’ outcomes, outcomes depend on neighbors’ covariates, and unobserved factors depend on neighbors’ unobserved factors. We want to combine them in a single model.
Example:
$$ \begin{aligned} \text{crime} &= \beta_0 \! + \! \beta_1 \! * \! \text{police} \! + \! \beta_3 \! * \!\text{unemployment} \! + \! \gamma \! * \! W_1 \! * \! \text{police} \! + \! \lambda \! * \! W_2 \! * \! \text{crime} \! + \! u \\ \\ u &= \rho M u + \epsilon \end{aligned} $$Code:
spregress crime police unemployment, gs2sls ivarlag(W1: police) dvarlag(W2) errorlag(M)
Higher-order spatial autoregressive models
Example: The crime rate in one county may affect its neighbors and the neighbors of its neighbors. We think the effects to the direct neighbors are different from the neighbors of neighbors, and we want to distinguish them in a single model.
Code:
/* create weighting matrix for direct neighbors */
spmatrix create contiguity W1

/* create weighting matrix for second order neighbors */
spmatrix create contiguity W2, second

/* fit higher-order spatial lag model */
spregress crime unemployment, gs2sls dvarlag(W1) dvarlag(W2)
Higher-order spatial lags means there are more than one Wy, Mu, or both in the model. For example, it is useful in some cases:
To better approximate the spatial spillover process, or
A different weighting matrix may have a different definition of neighbors.
spivregress: spatial IV regression
spivregress is very similar to spregress, but it allows endogenous covariates (instrumental variables regression).
spivregress fits the model like the following:
spivregress y1 x1 x2 (y2 y3 = z1 z2 z3), dvarlag(W) errorlag(M) ivarlag(W: x1)y2 and y3 are endogenous variables, and z1, z2, and z3 are instruments.
What we discussed for spregress also applies to spivregress.
- It fits general spatial autoregressive models.
- It allows higher-order spatial lags.
- Use estat impact, predict, and margins to interpret the results.
spxtregress: spatial panel-data autoregression
spxtregress fits spatial autoregressive models for panel data.
It provides both fixed-effects and random-effects estimators.
It fits models like the following:
/* fixed-effects estimation */
spxtregress y x1 x2 , fe dvarlag(W) errorlag(M) ivarlag(W: x1)

/* random-effects estimation */
spxtregress y x1 x2 i.year , re dvarlag(W) errorlag(M) ivarlag(W: x1)
Use estat impact, predict, and margins to interpret the results.
More resources
Here is a list of uncovered topics that you may be interested in reading about later.
Thanks !