Notice: On April 23, 2014, Statalist moved from an email list to a forum, based at statalist.org.
[Date Prev][Date Next][Thread Prev][Thread Next][Date Index][Thread Index]
st: RE: Combining a regression table with graph in Stata
From
"Barclay Matthew (PUBLIC HEALTH ENGLAND)" <[email protected]>
To
"[email protected]" <[email protected]>
Subject
st: RE: Combining a regression table with graph in Stata
Date
Mon, 3 Feb 2014 14:55:58 +0000
Hi Tim,
I'm currently doing something similar. My approach is to generate a variable containing the x-position for the table contents, and use -scatter- to plot it on the graph. So, to add the estimates to your example, I would do something like:
// to be run after Tim's code
gen str_est = string(estimate, "%09.2fc")
gen xpos = 3.5
twoway bar estimate axis, base(1) horizontal barw(.5) ///
xline(1) ylab(1/6, valuelabel ang(h) noticks) || ///
rcap min95 max95 axis, horizontal || ///
scatter axis xpos , msymb(none) mlabel(str_est) mlabp(3) ///
legend(order(1 "point estimate" ///
2 "95% conf. int.") pos(6)) ///
xtitle("odds ratio") ytitle("")
Clearly, you can continue adding -scatter-s until you've plotted everything you want to, or modify the variable you plot so it contains more information. To get it actually looking good can take a lot of playing around with the options. If anyone has a better method I'd be very interested.
Hope that helps,
Matt
-----Original Message-----
From: [email protected] [mailto:[email protected]] On Behalf Of Tim Evans
Sent: 03 February 2014 13:43
To: [email protected]
Subject: st: Combining a regression table with graph in Stata
Hi all,
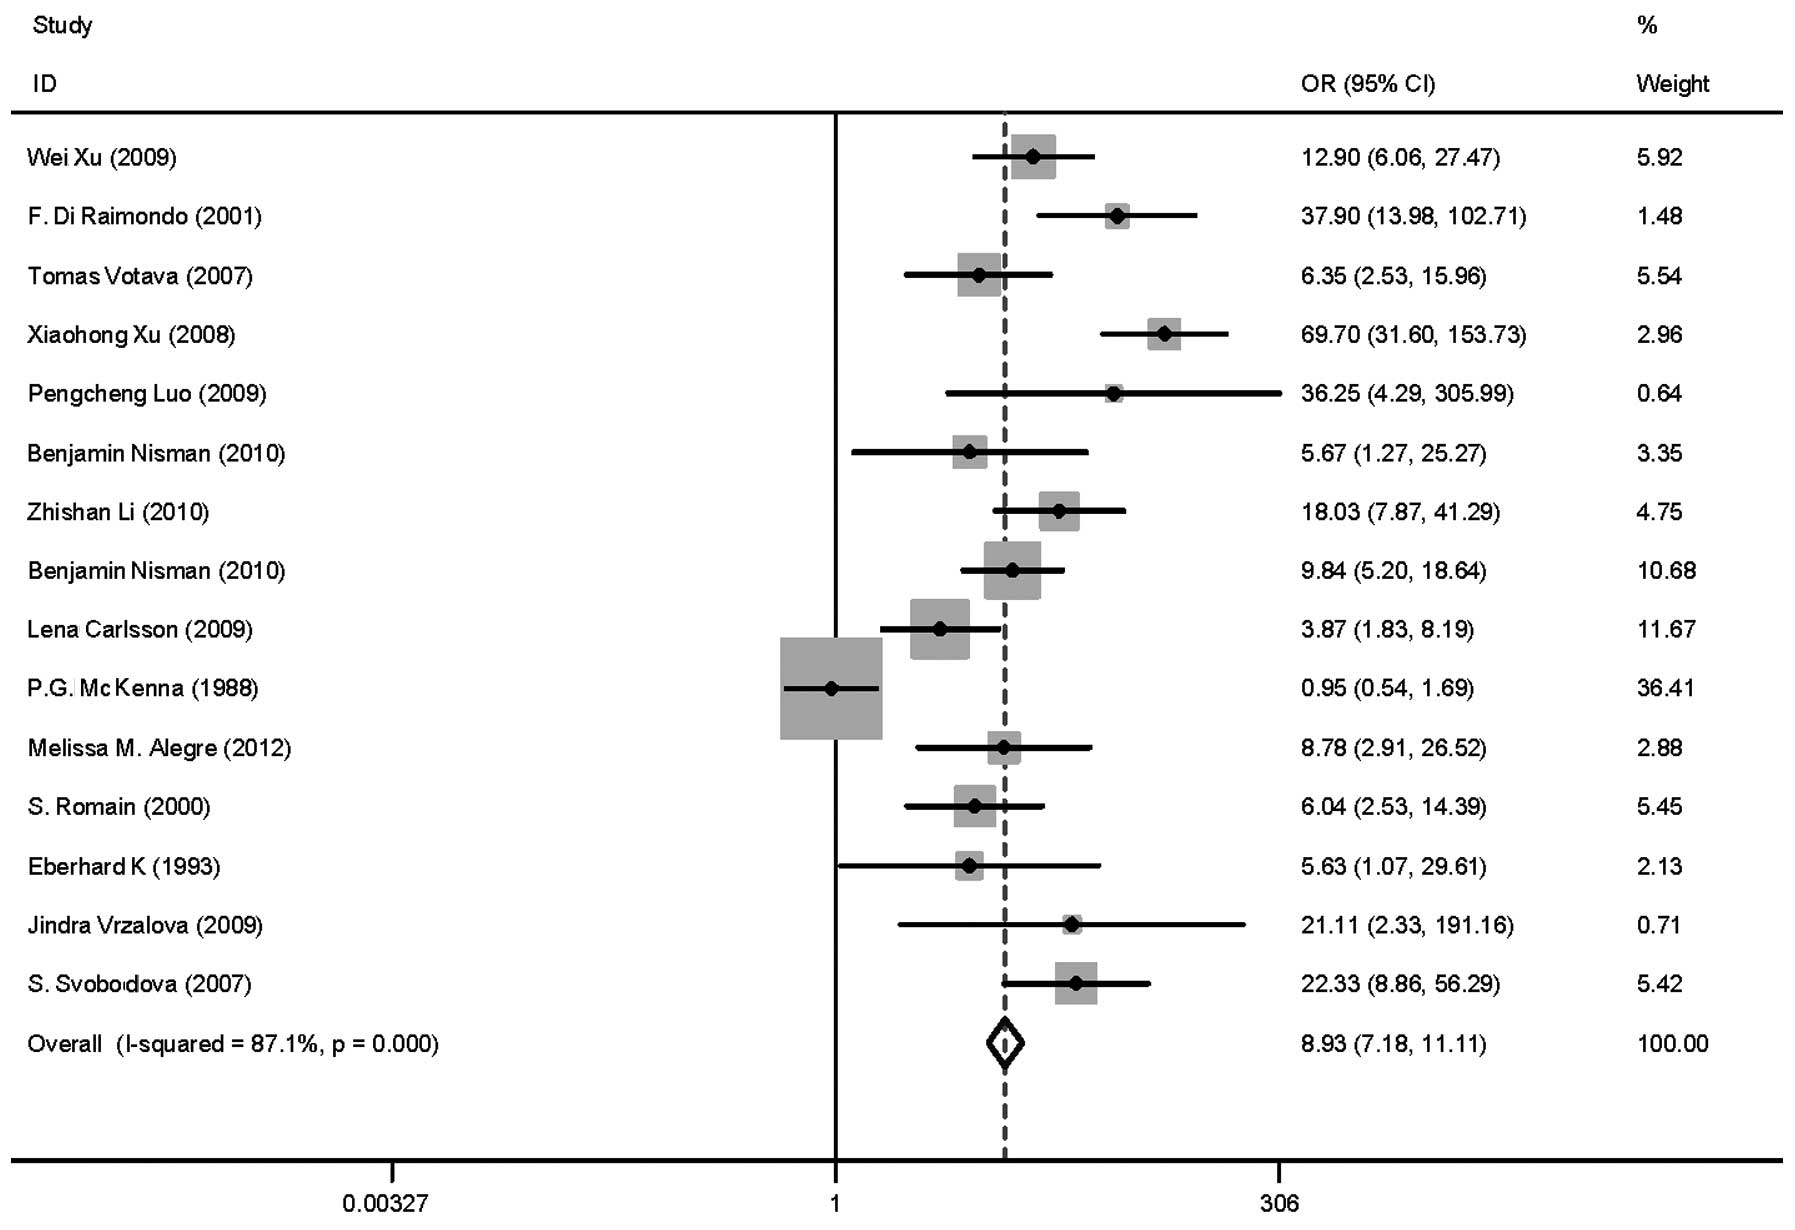
I'm using Stata 11.2 (although if it's easier for the solution can use Stata 13) and have run a logistic regression model and saved the results using -parmest- (available from SSC) into a stata .dta file. From here I can export the results into a table (MS Excel or other) or I can graph in Stata (which I do). However, I'm pushed for space in the publication so would like to know if there is a way in Stata to combine the estimates from the table along with the graphical representation (similar to this table/graph combination:
http://www.spandidos-publications.com/article_images/br/1/4/BR-01-04-0629-g02.jpg)
This is some example code that will produce the estimates in a stata file followed by the graph:
sysuse nlsw88, clear
replace ttl_exp = ttl_exp / 10 // experience in decades
replace grade = grade - 12 // center education at meaningful value
logit union i.race i.south grade ttl_exp, or
foreach v in grade ttl_ex { // continuous variables
local l`v' : variable label `v'
if `"`l`v''"' == "" { // if no variable label
local l`v' "`v'"
}
}
foreach v in south race { // factor variables
levelsof `v'
local `v'levs `r(levels)'
foreach l in ``v'levs' {
local l`v'_`l' : label (`v') `l'
if `"`l`v'_`l''"' == "`l'" { // if no value label
local l`v'_`l' `"`v' == `l'"'
}
}
}
parmest, norestore eform
foreach v in grade ttl_ex {
replace parm = "`l`v''" if parm == "`v'"
}
foreach v in south race {
local i = 1
foreach l in ``v'levs' {
if `i' == 1 {
drop if parm == "`l'b.`v'" // drop reference
}
else {
replace parm = "`l`v'_`l''" if parm == "`l'.`v'"
}
local i = `i' + 1
}
}
replace parm = "baseline odds" if parm == "_cons"
egen axis= axis(z), label(parm)
twoway bar estimate axis, base(1) horizontal barw(.5) ///
xline(1) ylab(1/6, valuelabel ang(h) noticks) || ///
rcap min95 max95 axis, horizontal ///
legend(order(1 "point estimate" ///
2 "95% conf. int.") pos(6)) ///
xtitle("odds ratio") ytitle("")
Best wishes
Tim
**************************************************************************
The information contained in the EMail and any attachments is confidential and intended solely and for the attention and use of the named addressee(s). It may not be disclosed to any other person without the express authority of Public Health England, or the intended recipient, or both. If you are not the intended recipient, you must not disclose, copy, distribute or retain this message or any part of it. This footnote also confirms that this EMail has been swept for computer viruses by Symantec.Cloud, but please re-sweep any attachments before opening or saving. http://www.gov.uk/PHE
**************************************************************************
*
* For searches and help try:
* http://www.stata.com/help.cgi?search
* http://www.stata.com/support/faqs/resources/statalist-faq/
* http://www.ats.ucla.edu/stat/stata/
********************************************************************************************************************
This message may contain confidential information. If you are not the intended recipient please inform the
sender that you have received the message in error before deleting it.
Please do not disclose, copy or distribute information in this e-mail or take any action in reliance on its contents:
to do so is strictly prohibited and may be unlawful.
Thank you for your co-operation.
NHSmail is the secure email and directory service available for all NHS staff in England and Scotland
NHSmail is approved for exchanging patient data and other sensitive information with NHSmail and GSi recipients
NHSmail provides an email address for your career in the NHS and can be accessed anywhere
********************************************************************************************************************
*
* For searches and help try:
* http://www.stata.com/help.cgi?search
* http://www.stata.com/support/faqs/resources/statalist-faq/
* http://www.ats.ucla.edu/stat/stata/