Notice: On April 23, 2014, Statalist moved from an email list to a forum, based at statalist.org.
[Date Prev][Date Next][Thread Prev][Thread Next][Date Index][Thread Index]
Re: st: How to get rid of outliers
From
Sergiy Radyakin <[email protected]>
To
"[email protected]" <[email protected]>
Subject
Re: st: How to get rid of outliers
Date
Thu, 24 Oct 2013 16:50:58 -0400
Xixi,
Richard has already answered this and correctly explained the reason
(you must use drop if in this particular case, which was not important
in the original situation). However I am more concerned about a
different point. This is not a mechanical extension of the case of one
variable to the case of three variables. Note that you are eliminating
the whole person, if any of his characteristics are extreme. But by
doing this you are distorting the distribution of the other
characteristics! From the practical point of view, you will have your
resulting sample different depending e.g. on the order of how the
variables Size, Volume, etc listed in the list. Which is never a good
thing. Especially if you have a qualitative conclusion, which reverses
itself when you change the order of these variables. Let's hope this
is not your case. But given this new information that you have shown,
I urge you to follow Nick's advice, and carefully reconsider, why you
want to eliminate anyone from your sample.
Also I noticed you renamed r and l to y and z. Not a good idea.
Originally letters were picked to denote "left" and "right". It is way
easier to read the code that way. Mentioning inrange(x,y,z) gives the
impression that x,y,z are of equal 'rank', while in fact they are not
(first is a variable, the other two are constants).
In any case here is an example with looping:
do http://radyakin.org/statalist/2013102401/remove_outliers2.do
(due to low number of observations and all observations coming from
the same year 1988, I took collgrad as the stratification var)
Best, Sergiy Radyakin
On Thu, Oct 24, 2013 at 5:23 PM, Richard Williams
<[email protected]> wrote:
> At 03:08 PM 10/24/2013, Xixi Lin wrote:
>>
>> Sergiy,
>>
>> One more question to bother you, I tried the single variable and it
>> works. Then I tried to do it by period. The code seems to be not
>> successful.
>>
>> Here is my code:
>> forvalues i=1/496{
>> foreach x in Return_lead1 Momentum Size Volume MB {
>> qui centile `x' if Period==`i', c(0.5 99.5)
>> local y=r(c_1)
>> local z=r(c_2)
>> keep if inrange(`x',`y',`z')& Period==`i'
>> }
>> }
>
>
> Everything in periods 2 through 496 is going to get dropped after the first
> time through the loop, because they won't meet the requirement that Period
> == 1. Not sure, but this might work:
>
> drop if !inrange(`x',`y',`z')& Period==`i'
>
>
>
>> Do you know what is wrong with my code? Thank you.
>>
>> Best,
>> Xixi Lin
>>
>> On Thu, Oct 24, 2013 at 3:47 PM, Sergiy Radyakin <[email protected]>
>> wrote:
>> > Xixi,
>> >
>> > statalist FAQ in 3.1 suggests to "Explain what doesn't work".
>> >
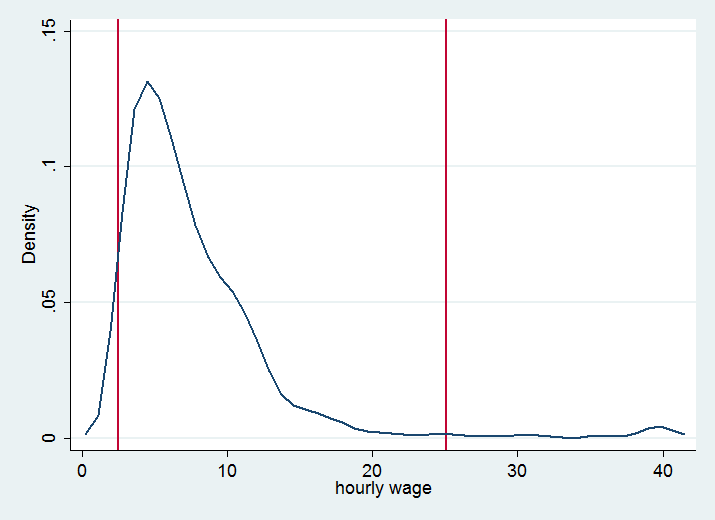
>> > The code I posted removes the persons from NLSW88 dataset shipped with
>> > Stata that report very low or very high wages, compared to the other
>> > people in this dataset (2.5% of low earners and 2.5% of high earners).
>> > It also plots the distribution graph, to give you an idea of what it
>> > is going to do (keep only people between the two red lines, remove the
>> > persons in the tails).
>> >
>> > The code is here:
>> > do http://radyakin.org/statalist/2013102401/remove_outliers.do
>> >
>> > The picture is here:
>> > http://radyakin.org/statalist/2013102401/wage_cut.png
>> >
>> > The program drops 112 persons, which is roughly .0498 of the sample.
>> > (you can only drop a _whole_ person, so that is not exactly 0.05).
>> >
>> > Now, what "seems to be not working" mean?
>> >
>> > Best, Sergiy Radyakin
>> >
>> >
>> >
>> > On Thu, Oct 24, 2013 at 2:54 PM, Xixi Lin <[email protected]> wrote:
>> >> Hi Sergiy,
>> >>
>> >> I tried your code, but it seems to be not working.
>> >>
>> >> Best,
>> >> Xixi Lin
>> >>
>> >> On Thu, Oct 24, 2013 at 11:55 AM, Sergiy Radyakin
>> >> <[email protected]> wrote:
>> >>> Xixi, listen to Nick's advice. But if you still want to drop them,
>> >>> here is how:
>> >>>
>> >>> sysuse nlsw88
>> >>> centile wage, c(2.5 97.5)
>> >>> local l=r(c_1)
>> >>> local r=r(c_2)
>> >>> kdensity wage, xline(`l') xline(`r')
>> >>> keep if inrange(wage, `l', `r')
>> >>>
>> >>> Best, Sergiy Radyakin
>> >>>
>> >>>
>> >>> On Thu, Oct 24, 2013 at 10:45 AM, Nick Cox <[email protected]>
>> >>> wrote:
>> >>>> If the question is simple
>> >>>>
>> >>>> How to get rid of outliers?
>> >>>>
>> >>>> then there is a good simple long answer
>> >>>>
>> >>>> Don't (usually).
>> >>>>
>> >>>> and a good simple short answer
>> >>>>
>> >>>> Don't.
>> >>>>
>> >>>> There are of course even longer answers in many places. The thread
>> >>>> starting at
>> >>>>
>> >>>> http://www.stata.com/statalist/archive/2007-06/msg00185.html
>> >>>>
>> >>>> throws a variety of lights on outliers and immodesty leads me to
>> >>>> recommend
>> >>>>
>> >>>> http://www.stata.com/statalist/archive/2007-06/msg00239.html
>> >>>>
>> >>>> as particularly long-winded, and respect leads me to nominate Richard
>> >>>> Goldstein's concise remark
>> >>>>
>> >>>> http://www.stata.com/statalist/archive/2007-06/msg00240.html
>> >>>>
>> >>>> as most penetrating of all. But the whole thread is worth looking
>> >>>> through
>> >>>>
>> >>>> One rather long footnote to the thread is provided by
>> >>>>
>> >>>> SJ-13-3 st0313 . . . . . . . . . . . . . . Speaking Stata: Trimming
>> >>>> to taste
>> >>>> (help trimmean, trimplot if installed) . . . . . . . . . .
>> >>>> N. J. Cox
>> >>>> Q3/13 SJ 13(3):640--666
>> >>>> tutorial review of trimmed means, emphasizing the scope for
>> >>>> trimming to varying degrees in describing and exploring data
>> >>>>
>> >>>> but the best Stata incantation of all is likely to be -glm-.
>> >>>>
>> >>>> More generally, modify your model so that outliers are accommodated.
>> >>>>
>> >>>> Don't modify your data because they are awkward to analyse.
>> >>>>
>> >>>> Nick
>> >>>> [email protected]
>> >>>>
>> >>>>
>> >>>> On 24 October 2013 15:31, Xixi Lin <[email protected]> wrote:
>> >>>>> Hi All,
>> >>>>>
>> >>>>> I know it seems to be a very simple question. But I still wanna ask
>> >>>>> how to keep 99%(95%) of the data? Is it just chop off 2 standard
>> >>>>> deviations? How to code it then?
>> >>>>>
>> >>>>> Thanks a lot.
>> >>>>>
>> >>>>> Best,
>> >>>>> Xixi Lin
>> >>>>> *
>> >>>>> * For searches and help try:
>> >>>>> * http://www.stata.com/help.cgi?search
>> >>>>> * http://www.stata.com/support/faqs/resources/statalist-faq/
>> >>>>> * http://www.ats.ucla.edu/stat/stata/
>> >>>> *
>> >>>> * For searches and help try:
>> >>>> * http://www.stata.com/help.cgi?search
>> >>>> * http://www.stata.com/support/faqs/resources/statalist-faq/
>> >>>> * http://www.ats.ucla.edu/stat/stata/
>> >>> *
>> >>> * For searches and help try:
>> >>> * http://www.stata.com/help.cgi?search
>> >>> * http://www.stata.com/support/faqs/resources/statalist-faq/
>> >>> * http://www.ats.ucla.edu/stat/stata/
>> >> *
>> >> * For searches and help try:
>> >> * http://www.stata.com/help.cgi?search
>> >> * http://www.stata.com/support/faqs/resources/statalist-faq/
>> >> * http://www.ats.ucla.edu/stat/stata/
>> >
>> > *
>> > * For searches and help try:
>> > * http://www.stata.com/help.cgi?search
>> > * http://www.stata.com/support/faqs/resources/statalist-faq/
>> > * http://www.ats.ucla.edu/stat/stata/
>>
>> *
>> * For searches and help try:
>> * http://www.stata.com/help.cgi?search
>> * http://www.stata.com/support/faqs/resources/statalist-faq/
>> * http://www.ats.ucla.edu/stat/stata/
>
>
> -------------------------------------------
> Richard Williams, Notre Dame Dept of Sociology
> OFFICE: (574)631-6668, (574)631-6463
> HOME: (574)289-5227
> EMAIL: [email protected]
> WWW: http://www.nd.edu/~rwilliam
>
> *
> * For searches and help try:
> * http://www.stata.com/help.cgi?search
> * http://www.stata.com/support/faqs/resources/statalist-faq/
> * http://www.ats.ucla.edu/stat/stata/
*
* For searches and help try:
* http://www.stata.com/help.cgi?search
* http://www.stata.com/support/faqs/resources/statalist-faq/
* http://www.ats.ucla.edu/stat/stata/