Notice: On April 23, 2014, Statalist moved from an email list to a forum, based at statalist.org.
Attachment:
attempt2.png
[Date Prev][Date Next][Thread Prev][Thread Next][Date Index][Thread Index]
RE: st: How to plot ORs and CI - results of a logistic regression
From
Sofia Ramiro <[email protected]>
To
Statalist <[email protected]>
Subject
RE: st: How to plot ORs and CI - results of a logistic regression
Date
Mon, 2 Jul 2012 11:31:18 +0100
Thank you.
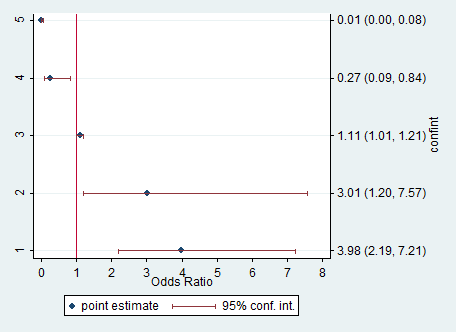
It is moving on the right direction (attached), but now the labels of the variables on the left-hand side disappeared, whereas earlier I had it. Any idea why?
On the right-hand side I do have the estimates and CI printed. Is it possible to get rid of the 2nd y-axis title "confint"? And is it possible to print on top of the estimates, something like "Odds Ratios (95% CI)"?
Thank you very much for your help!
Best wishes,
Sofia
----------------------------------------
> Date: Mon, 2 Jul 2012 10:34:31 +0100
> From: [email protected]
> To: [email protected]
> Subject: Re: st: How to plot ORs and CI - results of a logistic regression
>
> Sorry, I should have specified a -ylabel()- option for your -rcap- plot.
> This should probably be:
>
> ylabel(, valuelabel angle(0) axis(2))
>
> which should cause the values of -confint- to be printed with value
> labels, which should be confidence intervals.
>
> I hope this helps. Let me know if it doesn't.
>
> Best wishes
>
> Roger
>
>
> Roger B Newson BSc MSc DPhil
> Lecturer in Medical Statistics
> Respiratory Epidemiology and Public Health Group
> National Heart and Lung Institute
> Imperial College London
> Royal Brompton Campus
> Room 33, Emmanuel Kaye Building
> 1B Manresa Road
> London SW3 6LR
> UNITED KINGDOM
> Tel: +44 (0)20 7352 8121 ext 3381
> Fax: +44 (0)20 7351 8322
> Email: [email protected]
> Web page: http://www.imperial.ac.uk/nhli/r.newson/
> Departmental Web page:
> http://www1.imperial.ac.uk/medicine/about/divisions/nhli/respiration/popgenetics/reph/
>
> Opinions expressed are those of the author, not of the institution.
>
>
> On 01/07/2012 21:31, Sofia Ramiro wrote:
>>
>> yes, you are totally right. Sorry about this.
>> Now I manage to run it and to get a graph. however, I don't have the estimates and CI printed on the right-hand side. The only thing added in this graph was a 2nd y-axis on the right named "confint" and nothing else differed. I am not sure I will be able to send the graph attached, but I will try.
>> Any hints?
>> thanks!
>>
>> Best wishes,
>> Sofia
>>
>> ----------------------------------------
>>> Date: Sun, 1 Jul 2012 20:53:48 +0100
>>> From: [email protected]
>>> To: [email protected]
>>> Subject: Re: st: How to plot ORs and CI - results of a logistic regression
>>>
>>> I suspect that you have an out-of-date version of -sdecode-. If your
>>> current version of Stata is Version 11 or higher, then you should update
>>> -sdecode- (and -bmjcip-) to the most recent version downloadable from SSC.
>>>
>>> I hope this helps. Let me know if it doesn't.
>>>
>>> Best wishes
>>>
>>> Roger
>>>
>>> Roger B Newson BSc MSc DPhil
>>> Lecturer in Medical Statistics
>>> Respiratory Epidemiology and Public Health Group
>>> National Heart and Lung Institute
>>> Imperial College London
>>> Royal Brompton Campus
>>> Room 33, Emmanuel Kaye Building
>>> 1B Manresa Road
>>> London SW3 6LR
>>> UNITED KINGDOM
>>> Tel: +44 (0)20 7352 8121 ext 3381
>>> Fax: +44 (0)20 7351 8322
>>> Email: [email protected]
>>> Web page: http://www.imperial.ac.uk/nhli/r.newson/
>>> Departmental Web page:
>>> http://www1.imperial.ac.uk/medicine/about/divisions/nhli/respiration/popgenetics/reph/
>>>
>>> Opinions expressed are those of the author, not of the institution.
>>>
>>>
>>> On 01/07/2012 20:41, Sofia Ramiro wrote:
>>>> Thank you very much for your hel, Roger.
>>>> The first part worked very well and now I manage to include the variable labels, thanks!
>>>> however, I got some problems with the 2nd part
>>>>
>>>> . bmjcip S_1 S_2 S_3, cformat(%8.2f)
>>>> option ftrim not allowed
>>>>
>>>> I still tried using other cformats and even xmlsub, but none of them worked.
>>>> Can you please help me?
>>>>
>>>> thanks!
>>>>
>>>> Sofia
>>>>
>>>> ----------------------------------------
>>>>> Date: Sun, 1 Jul 2012 20:12:14 +0100
>>>>> From: [email protected]
>>>>> To: [email protected]
>>>>> Subject: Re: st: How to plot ORs and CI - results of a logistic regression
>>>>>
>>>>> To reconstruct the variable labels into a variable with value labels,
>>>>> use the -label- option of -parmest-, together with the -sencode-
>>>>> package, which you can also download from SSC, and which is a "super"
>>>>> version of -encode-. As in:
>>>>>
>>>>> #delim ;
>>>>> logistic asdasimprov3M1 asdascalc male num_anos_escolaridade
>>>>> eva_total_colunaconvhighlow4;
>>>>> parmest, norestore eform label;
>>>>> sencode label, gene(parmlab);
>>>>> twoway scatter parmlab estimate,
>>>>> xline(1) ylab(, valuelabel angle(0)) ||
>>>>> rcap min95 max95 parmlab, horizontal
>>>>> legend(order(1 "point estimate"
>>>>> 2 "95% conf. int.") pos(6))
>>>>> xlabel(0(1)8) xtitle("Odds Ratio") ytitle("");
>>>>>
>>>>> And, if you want to print the estimates and confidence limits on the
>>>>> right-hand side of the graph, then you can download the -sdecode- and
>>>>> -bmjcip- packages from SSC, and use those. (-sdecode- is a "super"
>>>>> version of -decode-, and -bmjcip- is a front end for -sdecode-.) As in:
>>>>>
>>>>> #delim ;
>>>>> logistic asdasimprov3M1 asdascalc male num_anos_escolaridade
>>>>> eva_total_colunaconvhighlow4;
>>>>> parmest, norestore eform label;
>>>>> sencode label, gene(parmlab);
>>>>> clonevar S_1=estimate;
>>>>> clonevar S_2=min95;
>>>>> clonevar S_3=max96;
>>>>> bmjcip S_1 S_2 S_3, cformat(%8.2f);
>>>>> gene confint=S_1+" "+S_2+" "+S_3;
>>>>> sencode confint, many replace;
>>>>> twoway scatter parmlab estimate,
>>>>> xline(1) ylab(, valuelabel angle(0)) yaxis(1) ||
>>>>> rcap min95 max95 confint, horizontal yaxis(2) || ,
>>>>> legend(order(1 "point estimate"
>>>>> 2 "95% conf. int.") pos(6))
>>>>> xlabel(0(1)8) xtitle("Odds Ratio") ytitle("");
>>>>>
>>>>> This should give the confidence intervals for the odds ratios on the
>>>>> right-hand axis to 2 decimal places. (Let me know if it doesn't.)
>>>>>
>>>>> Best wishes
>>>>>
>>>>> Roger
>>>>>
>>>>>
>>>>> Roger B Newson BSc MSc DPhil
>>>>> Lecturer in Medical Statistics
>>>>> Respiratory Epidemiology and Public Health Group
>>>>> National Heart and Lung Institute
>>>>> Imperial College London
>>>>> Royal Brompton Campus
>>>>> Room 33, Emmanuel Kaye Building
>>>>> 1B Manresa Road
>>>>> London SW3 6LR
>>>>> UNITED KINGDOM
>>>>> Tel: +44 (0)20 7352 8121 ext 3381
>>>>> Fax: +44 (0)20 7351 8322
>>>>> Email: [email protected]
>>>>> Web page: http://www.imperial.ac.uk/nhli/r.newson/
>>>>> Departmental Web page:
>>>>> http://www1.imperial.ac.uk/medicine/about/divisions/nhli/respiration/popgenetics/reph/
>>>>>
>>>>> Opinions expressed are those of the author, not of the institution.
>>>>>
>>>>>
>>>>> On 01/07/2012 19:13, Sofia Ramiro wrote:
>>>>>> Dear Statalist members,
>>>>>>
>>>>>> I am trying to plot the results of a logistic regression. I would like to have a graph with the ORs and 95%CI plotted.
>>>>>> On the y-axis I would like to include the label of the variables names and, ideally (if possible), I would like to add, on the right hand side of the graph, the ORs and 95%CI written (just as we see for the forrest plots in a meta-analysis).
>>>>>> Having reviewed what as been written on this topic on statalist, this is what I did:
>>>>>>
>>>>>> logistic asdasimprov3M1 asdascalc male num_anos_escolaridade eva_total_colunaconvhighlow4
>>>>>> parmest, norestore eform
>>>>>> egen axis= axis(estimate), label(parm)
>>>>>> twoway scatter axis estimate, ///
>>>>>> xline(1) ylab(, valuelabel angle(0)) || ///
>>>>>> rcap min95 max95 axis, horizontal ///
>>>>>> legend(order(1 "point estimate" ///
>>>>>> 2 "95% conf. int.") pos(6)) ///
>>>>>> xlabel(0(1)8) xtitle("Odds Ratio") ytitle("")
>>>>>>
>>>>>> My problems are:
>>>>>> - On the y-axis I get the variables' names, but they are abbreviated names for my own use - how do I manage to put there labels - eg instead of male, I would like to have "Male gender (vs. female)" ?
>>>>>> - Is it to possible to create a column on the right hand side of the graph where the ORs and 95%CI are written (in addition to being ploted in the graph)? If yes, how?
>>>>>>
>>>>>> thanks!
>>>>>>
>>>>>> Sofia
>>>>>>
>>>>>> *
>>>>>> * For searches and help try:
>>>>>> * http://www.stata.com/help.cgi?search
>>>>>> * http://www.stata.com/support/statalist/faq
>>>>>> * http://www.ats.ucla.edu/stat/stata/
>>>>>>
>>>>>
>>>>> *
>>>>> * For searches and help try:
>>>>> * http://www.stata.com/help.cgi?search
>>>>> * http://www.stata.com/support/statalist/faq
>>>>> * http://www.ats.ucla.edu/stat/stata/
>>>>
>>>> *
>>>> * For searches and help try:
>>>> * http://www.stata.com/help.cgi?search
>>>> * http://www.stata.com/support/statalist/faq
>>>> * http://www.ats.ucla.edu/stat/stata/
>>>>
>>>
>>> *
>>> * For searches and help try:
>>> * http://www.stata.com/help.cgi?search
>>> * http://www.stata.com/support/statalist/faq
>>> * http://www.ats.ucla.edu/stat/stata/
>>
>>
>
> *
> * For searches and help try:
> * http://www.stata.com/help.cgi?search
> * http://www.stata.com/support/statalist/faq
> * http://www.ats.ucla.edu/stat/stata/
Description: PNG image