Notice: On April 23, 2014, Statalist moved from an email list to a forum, based at statalist.org.
Attachment:
exp.png
[Date Prev][Date Next][Thread Prev][Thread Next][Date Index][Thread Index]
st: TABOUT - Question / with exp.png
From
"Rilke Rainer Michael" <[email protected]>
To
<[email protected]>
Subject
st: TABOUT - Question / with exp.png
Date
Fri, 24 Sep 2010 10:51:21 +0200
Hello,
I have a question concerning the tool: TABOUT.
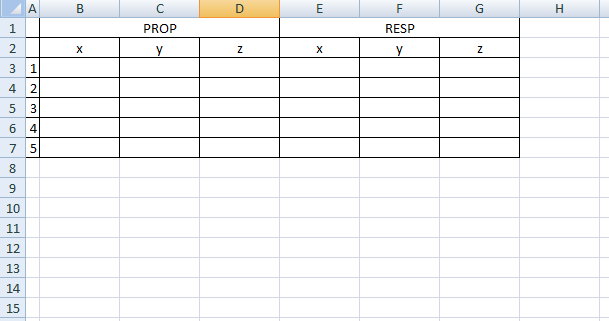
Basically I want a table that looks like the example in the attachment.
Whereas PROP and RESP AND (1-5) are variables defining two different
categories. X,Y and Z should be displayed in means and sd.
Acutally I used tabout to solve this problem and typed in the following
code:
tabout (1-5) (Prop/Resp) using blabla.tex, style(tex) replace c( mean x
mean y mean z) sum
Tabout produces the following tables:
& \multicolumn{3}{c}{Mean} \\
&x&y &z \\
\hline
(1-5)&&& \\
1&0.5&63.1&67.4 & 32.23 \\
2&0.5&82.3&75.7 & 32.23\\
3&0.5&98.2&89.3 & 32.23\\
4&0.5&113.2&112.1 & 32.23\\
5&0.5&149.7&144.3 & 32.23\\
Total&0.5&100.5&95.7 & 32.23\\
\hline
(PROP/RESP)&&& \\
RESP&0.0&100.4&102.9 & 32.23\\
PROP&1.0&100.6&88.5 & 32.23\\
Total&0.5&100.5&95.7 & 32.23\\
If anyone has any suggestions I would be pleased to hear your comment.
Kind Regards,
Rainer
Description: exp.png