Notice: On April 23, 2014, Statalist moved from an email list to a forum, based at statalist.org.
[Date Prev][Date Next][Thread Prev][Thread Next][Date Index][Thread Index]
Re: st: Boxplot - color coded + cat labels | documenting work round
From
Sergiy Radyakin <[email protected]>
To
"[email protected]" <[email protected]>
Subject
Re: st: Boxplot - color coded + cat labels | documenting work round
Date
Thu, 31 Oct 2013 15:43:52 -0400
Dear Allan,
I certainly do not have your data on animal lengths, but when I tried
to run your code on the mock data I get the picture with blue F-boxes,
and pink M-boxes, which goes against [mine] intuition. I didn't put
any efforts to determine whether the colors have been applied the
other way around (in which case it is not a problem, since it is just
preference), or the labels were misapplied (recall that you are
recoding them manually, in which case it can be a problem). Perhaps it
is a false alarm because of my coding, then I apologize in advance.
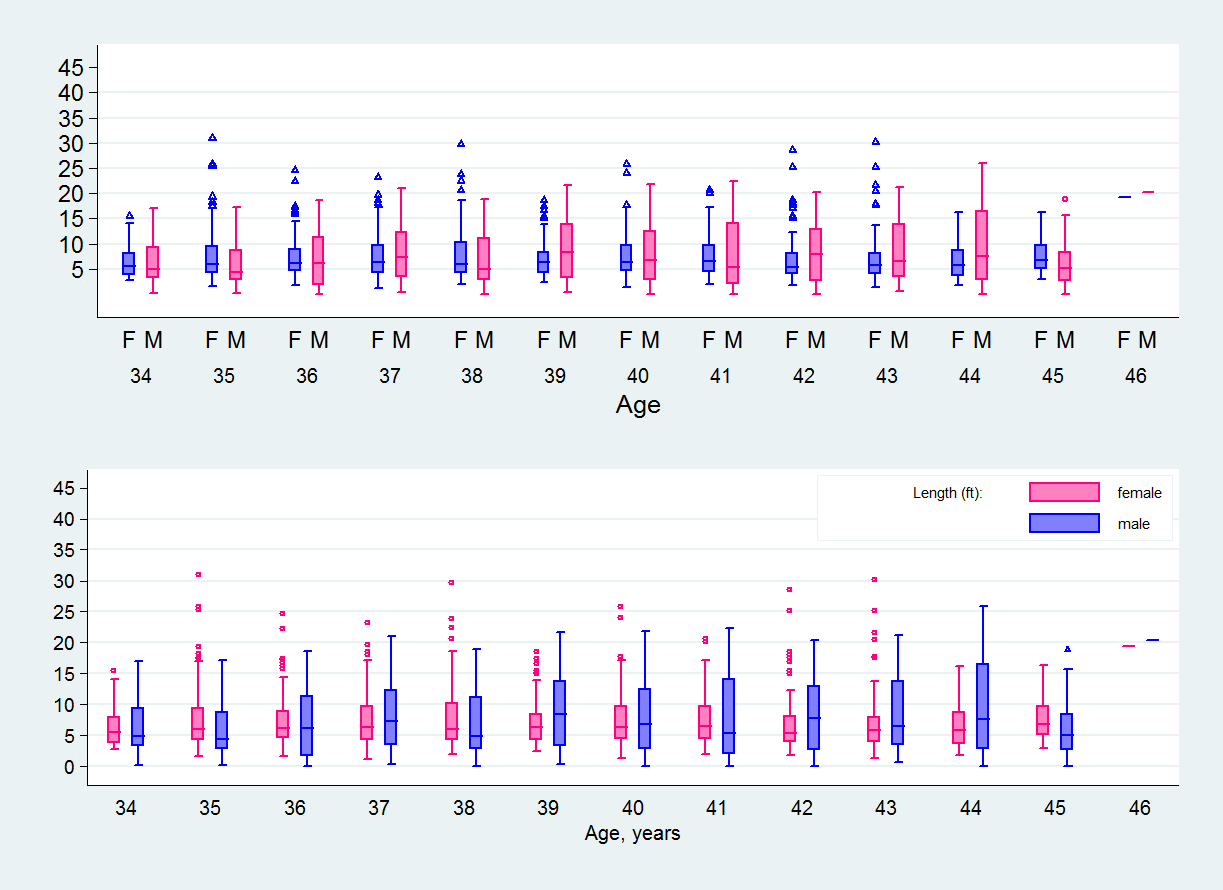
Also, why would you resist the legend so much? In the case of this
graph, it actually makes a lot of sense, since you avoid of the
repetitive M-F pairs all over the horizontal axis. I've put two graphs
side-by-side here:
http://www.radyakin.org/statalist/2013103101/twographs.png
http://www.radyakin.org/statalist/2013103101/twographs.do
(do file transforms nlsw88 data to create an example data, so it is runnable)
I think your (top) graph is preferable in the black-and-white
publication, since color is not an option, and the bars must be
identifiable. However, since you are using the colors (blue and pink),
it tells me that you are probably not going to disseminate the results
in black-and-white, so perhaps the labels can be skipped.
And also one request to StataCorp, can we have the standard Mars/Venus
symbols for markers on graphs? (in addition to squares, diamonds, and
triangles): http://en.wikipedia.org/wiki/Gender_symbol
Best, Sergiy Radyakin
On Thu, Oct 31, 2013 at 11:25 AM, Allan Reese (Cefas)
<[email protected]> wrote:
> I drew a standard boxplot with two levels of category and thought it would be cute in color. I like to avoid separate legends when possible. After considerable struggle I got there, and *then* RTFM where there is a table of the differences between box with multiple yvars and box with over() groups. It states "multiple yvars : different color & legend", "over() groups : no colors & axis labels".
>
> So here's the solution, and a suggestion that when multiple yvars have been reclassified "ascat", you ought to be able to apply the over() subopts! I'll leave this with my variables, which are length (of animal) compared over sex and age. The lengths were in one var (to use over() ) and have been split into vars for each sex.
>
> graph box flen mlen, over( sex, relabel(1 "F" 2 "M") ) nofill legend(off)///
> box( 2, col(pink) ) box(1, col(blue)) ///
> marker( 2, ms(oh) mcol(pink) msize(*.8)) marker( 1, ms(th) mcol(blue) msize(*.8)) ///
> over( age, lab( labsize(*.8) ) gap(*2) ) ///
> ylab(5(5)45, angle(0) ) b1(Age)
>
> Allan
>
>
>
> *
> * For searches and help try:
> * http://www.stata.com/help.cgi?search
> * http://www.stata.com/support/faqs/resources/statalist-faq/
> * http://www.ats.ucla.edu/stat/stata/
*
* For searches and help try:
* http://www.stata.com/help.cgi?search
* http://www.stata.com/support/faqs/resources/statalist-faq/
* http://www.ats.ucla.edu/stat/stata/